

Think intraday rallies are crowd-driven? Often they’re not.
Large institutional buys can sweep the order book and force prices to move just to find counterparties.
That creates immediate directional pressure, wider spreads, and a chain reaction from algos and stop orders.
Thesis: institutional order flow, via aggressive sweeps, hidden (iceberg) prints and VWAP-based slicing, is a primary driver of intraday momentum.
Spotting those footprints on tape and depth-of-book helps you tell if a move will keep running or soon reverse.
Immediate Intraday Effects of Institutional Order Flow

When an institution executes a large order, the market doesn’t absorb it quietly. They’re trading in sizes that consume whatever liquidity is sitting there, which forces prices to move just to find enough people willing to take the other side. A pension fund buying millions of dollars in shares or a hedge fund dumping a big position shifts the immediate balance of supply and demand. You’ll see directional pressure show up in real time as abrupt price moves and wider bid-ask spreads. That’s market impact in its simplest form, and it happens within seconds or minutes.
Market impact has two phases: temporary and permanent. Temporary impact is the immediate spike or dip caused by the order itself, as the buyer or seller walks up or down the order book. Permanent impact is the sustained shift in price that sticks around after execution finishes. During a single session, both matter. If an institution aggressively sweeps bids or offers, the temporary impact can be large enough to trigger stop losses, momentum algorithms, and retail FOMO. All of which amplify the move. The initial spark from institutional order flow often sets off a chain reaction, especially when liquidity is thin or when high-frequency algos detect imbalance and join the direction.
Order imbalances and large block prints are among the earliest signals that institutional pressure is entering the tape. When you see aggressive execution clearing multiple price levels in quick succession, it’s typically not retail. That kind of velocity and size signals a large player moving into or out of a position. The reaction from other participants creates the momentum that follows. Algos adjusting quotes, market makers pulling depth, retail chasing.
Measurable intraday footprints of institutional order flow include:
Volume spikes. Sudden jumps in traded volume far above the session average, often visible as tall bars on time-and-sales and volume charts.
Aggressive sweeps. Market orders that eat through multiple price levels in a single print or rapid sequence, clearing resting limit orders.
Abrupt spread changes. Widening bid-ask spreads as market makers react to perceived information or withdraw liquidity in the face of size.
Order-book imbalance. Heavy concentration of buy or sell interest at specific levels, visible as heat clusters on depth-of-market displays.
VWAP dislocation. Price moving sharply away from VWAP without reverting, signaling sustained one-directional pressure rather than noise.
Order Execution Mechanics That Drive Momentum

Institutions rarely announce their intentions. Instead, they use a range of execution tactics designed to minimize market impact and hide the full size of their orders. VWAP (volume-weighted average price) and TWAP (time-weighted average price) algorithms slice large parent orders into smaller child orders spread across the session, blending execution into the natural flow of trading. These strategies reduce immediate price disruption but create sustained directional pressure over hours. When an institution is accumulating via VWAP execution, the buying doesn’t stop after one spike. It continues as long as the algorithm is active, creating persistent upward drift that momentum traders can ride.
Iceberg orders are another common tool. These display only a small portion of the total order size on the visible book, with the remainder hidden. Each time the visible portion fills, the system automatically replenishes it from the hidden reserve. To the market, it looks like a steady stream of smaller orders at the same price, but the aggregate size can be massive. Dark pools take this further by matching institutional buyers and sellers off the public order book entirely, so the trade doesn’t appear until after execution. When those prints do surface, they often come as large block trades reported with a delay, signaling that significant repositioning has already occurred.
Order slicing and hidden-size execution are designed to disguise intent, but they leave traces. Repeated fills at the same price level, persistent depth that doesn’t decrease despite multiple trades, and time-and-sales clustering all hint at iceberg activity. Spotting these patterns helps traders anticipate continuation, because the institution behind the iceberg likely has more to buy or sell.
Detecting Hidden Institutional Execution
Iceberg orders reveal themselves through behavioral patterns in the order book and time-and-sales feed. Because the visible portion refreshes automatically, you’ll see repeated small fills at a single price without the displayed depth depleting. Tracking these cues requires order-level data (market-by-order, or MBO), which timestamps and sizes individual orders rather than aggregating them by price level.
Key iceberg detection cues include:
Persistent displayed size. The same bid or offer size reappears immediately after being filled, indicating automatic replenishment from hidden reserves.
Repeated small fills. Multiple trades execute against the same price level in quick succession, yet the level remains active with similar size.
Time clustering on MBO feeds. Identical order IDs or rapid sequential timestamps at a single price suggest a single large hidden parent order.
Lack of depth decay. The order book shows steady liquidity at a level that should be exhausted given the volume traded, signaling hidden liquidity behind the visible quotes.
Market Microstructure Patterns Shaped by Institutional Buying

When a large order sweeps the book, depth collapses. Resting limit orders at nearby price levels get filled in quick succession, and the next available liquidity sits much farther away. This forces the aggressor to pay progressively higher prices to complete the fill, creating a visible upward stair-step in price. The thinner the liquidity, the steeper the climb. Once the easy fills are gone, market makers and liquidity providers reassess, often pulling their quotes back until the flurry subsides. That withdrawal of passive orders is what turns a simple large buy into a momentum spike.
Bid-ask spreads widen as market makers react to the signal embedded in aggressive execution. A large institutional buy suggests someone has information, conviction, or urgency. Market makers don’t want to be on the wrong side of that trade, so they widen their spreads to increase the cost of trading and reduce their own risk. Wider spreads mean higher slippage for anyone trying to enter or exit, which discourages casual participants and amplifies volatility. The spread itself becomes a signal. Tight spreads suggest calm, balanced flow. Wide spreads suggest turmoil, asymmetry, or institutional involvement.
Institutional buying distorts intraday price discovery. Prices should reflect the collective view of all participants, but when one participant is orders of magnitude larger than the rest, their activity dominates. Continuous buying pressure pushes prices higher not because fundamental information changed, but because supply at lower levels has been exhausted. This creates short-term inefficiencies that momentum traders exploit. The challenge is recognizing when the institutional flow is ending, because once the large buyer steps aside, the momentum often reverses just as abruptly as it began.
VWAP‑Driven Institutional Bias and Intraday Momentum Signals
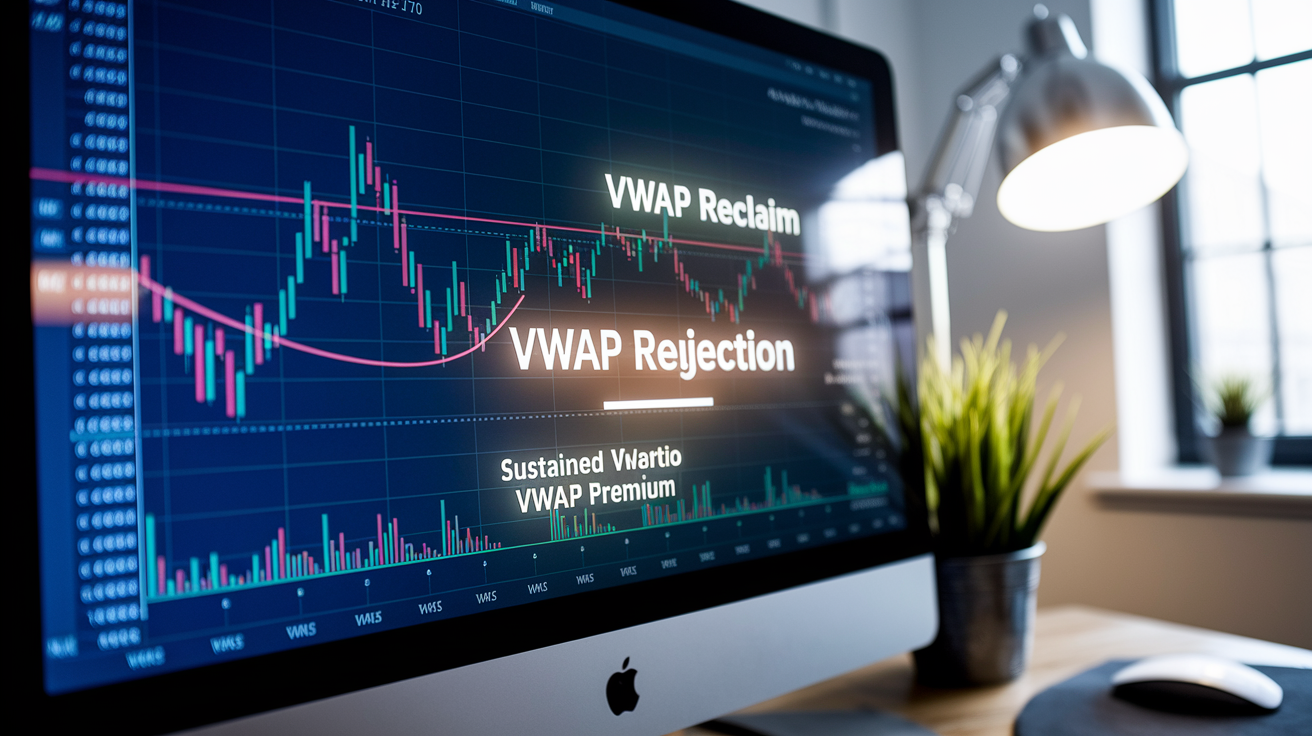
Most institutional execution desks are benchmarked against VWAP. Their goal is to execute at or better than the session’s volume-weighted average price, which means they prefer to buy below VWAP and sell above it. This creates predictable behavioral patterns. When price dips below VWAP, institutional algos often step in as buyers, providing support. When price runs well above VWAP, institutions may pull back or even turn into sellers, especially if they’re rebalancing or trimming. Watching how price interacts with VWAP throughout the session reveals whether institutions are still accumulating or starting to fade.
Sustained trading above VWAP signals that buyers are willing to pay up, often a sign that institutional accumulation is strong enough to overcome the natural pull back to average price. Conversely, repeated rejections at VWAP suggest selling pressure or reluctance to chase, and breakdowns below VWAP without a quick reclaim indicate weakening institutional support. Pullbacks to VWAP are classic add zones for institutions running multi-hour execution strategies, which is why price often bounces sharply when it touches VWAP intraday. The algos are programmed to buy there.
| Signal | Interpretation | Expected Momentum Effect |
|---|---|---|
| VWAP reclaim | Price breaks back above VWAP after a dip, often with increased volume, suggesting institutional buying resumed at or below average price | Resumption of upward momentum. Continuation likely if volume supports the reclaim |
| VWAP rejection | Price attempts to push above VWAP but is met with selling pressure and falls back below, indicating institutions are not willing to chase or are actively selling | Momentum stalls or reverses. Lower prices likely unless institutional support returns |
| Sustained VWAP premium | Price trades consistently above VWAP for extended periods without meaningful pullbacks, signaling aggressive institutional accumulation and willingness to pay above average | Strong continuation bias. Momentum often persists until price significantly overextends or volume dries up |
Intraday Momentum Ignition and Continuation Patterns Triggered by Institutions

Momentum ignition begins with a large, aggressive market order that sweeps multiple levels in the order book. This initial burst clears out resting liquidity and forces price to jump to the next cluster of available orders. The speed and size of the move catch the attention of momentum algorithms and retail scanners, which then pile in, amplifying the original institutional impulse. The key question is whether the move continues or fades. Continuation depends on whether the institution keeps buying or whether the initial spike was a one-off block trade.
After the initial sweep, a liquidity vacuum often follows. With nearby levels cleared and market makers widening spreads, there’s less resistance to further price movement in the same direction. If the institution is executing a multi-hour VWAP strategy, follow-through is likely, as additional child orders keep hitting the tape. If the spike was a single block trade and the institution is done, price often retraces once retail profit-taking begins and algos mean-revert. Distinguishing between these scenarios requires watching volume, order-book replenishment, and whether price holds above the breakout level.
Momentum ignition and continuation unfold in four phases:
Initial sweep. A large aggressive order clears multiple price levels in quick succession, generating a sharp directional move and elevated volume.
Liquidity vacuum. Nearby resting orders are exhausted, spreads widen, and price moves more easily in the direction of the sweep due to reduced resistance.
Follow-through. Additional institutional flow or momentum-chasing algos and retail traders enter, sustaining the move and pushing price further from the initial breakout.
Eventual exhaustion. Institutional execution completes, volume drops, spreads normalize, and price either consolidates or reverses as early participants take profits and new liquidity stabilizes the book.
Case Study: Block Trades and Momentum Reactions in Real Time
A hedge fund decides to accumulate a 500,000-share position in a mid-cap tech stock trading around $50. Rather than place a single market order and spike the price, the desk splits the parent order across the session using a VWAP algo. At 10:15 AM, the first aggressive child order hits: a 25,000-share market buy that sweeps offers from $50.00 to $50.15. Volume surges, the bid-ask spread widens from three cents to twelve cents, and price jumps to $50.18 within seconds. Retail momentum scanners flag the spike, and additional buying follows. By 10:30, the stock is trading at $50.35, supported by continued institutional flow as the VWAP algo keeps executing.
At 11:00, price pulls back to $50.25, right at the session VWAP, and finds immediate support. Another wave of buying appears, this time visible as repeated small fills at $50.25 on the bid, suggesting an iceberg order. The institution is adding on the pullback, a classic VWAP-benchmarked tactic. Price bounces back above $50.35 and continues higher through midday, reaching $50.60 by 1:00 PM. The block trade and subsequent VWAP execution created sustained intraday momentum, with measurable footprints in volume, spread behavior, and order-book clustering.
Analyzing Order-Book Reaction
When the initial 25,000-share sweep hit, depth on the offer side collapsed. The next available liquidity sat fifteen cents higher, forcing the aggressor to walk the book. Market makers pulled their quotes, widening the spread and reducing displayed depth by more than 60 percent within thirty seconds. As price stabilized near $50.18, passive liquidity slowly returned, but spreads remained elevated for the next twenty minutes. The pullback to VWAP triggered another round of aggressive buying, this time with tighter spreads as the book had replenished. By the time the stock reached $50.60, order-book depth had normalized, but the upward pressure remained visible in sustained above-VWAP trading and elevated relative volume.
Measurable outcomes from the block-trade event:
Slippage. The effective execution price for the initial sweep was approximately $50.10, six cents above the starting mid-market price, representing 0.12 percent slippage.
Volatility spike. Intraday realized volatility increased by 40 percent in the thirty minutes following the initial block, measured by five-minute rolling standard deviation of returns.
Momentum persistence. Price remained above the initial breakout level ($50.15) for the remainder of the session, closing at $50.55, confirming sustained institutional support.
Reversion risk. The stock gapped down 0.8 percent the following morning as institutions finished execution and profit-taking began, illustrating the temporary nature of intraday momentum once the catalyst ends.
Risk Management When Riding Institutional Momentum

Following institutional order flow can be profitable, but it comes with execution and timing risk. Institutions often finish their buying before retail traders realize the move is over, leaving late entrants holding positions into a reversal. Effective risk management starts with tight stops placed at logical levels, typically just below VWAP, just under the most recent swing low, or beneath a key order-book support cluster. The goal is to exit quickly if the institutional bid disappears, rather than riding a momentum spike all the way back down.
Position sizing should reflect intraday volatility. Using Average True Range (ATR) to scale position size ensures that a stop-out doesn’t exceed a predefined risk threshold. The 1 to 2 percent risk-per-trade guideline is standard: calculate the distance from entry to stop in dollars, then size the position so that distance equals 1 to 2 percent of total capital. This approach keeps any single trade from causing meaningful damage, even if institutional momentum reverses abruptly. Late-day risk reduction is also critical. Many intraday moves fade into the close as institutions finish execution and algos flatten positions, so trimming or exiting before the final thirty minutes reduces exposure to end-of-day reversals.
Specific risk management methods for institutional momentum trades:
ATR-based sizing. Divide risk capital by ATR to determine share size, ensuring position size adjusts automatically to current volatility levels.
Volatility stops. Place stops one ATR below entry for long positions, dynamically tightening as price moves in your favor to lock in gains.
VWAP-adjacent stops. Use VWAP as a dynamic stop level, exiting if price breaks convincingly below VWAP, signaling institutional support has faded.
Late-day risk reduction. Reduce or close positions in the final thirty minutes of the session to avoid end-of-day volatility and institutional rebalancing flows.
Slippage mitigation. Use limit orders when possible and avoid chasing fast moves. If you can’t get a reasonable fill within a few cents, the momentum may already be overextended.
Time‑of‑Day Effects on Institutional Intraday Momentum
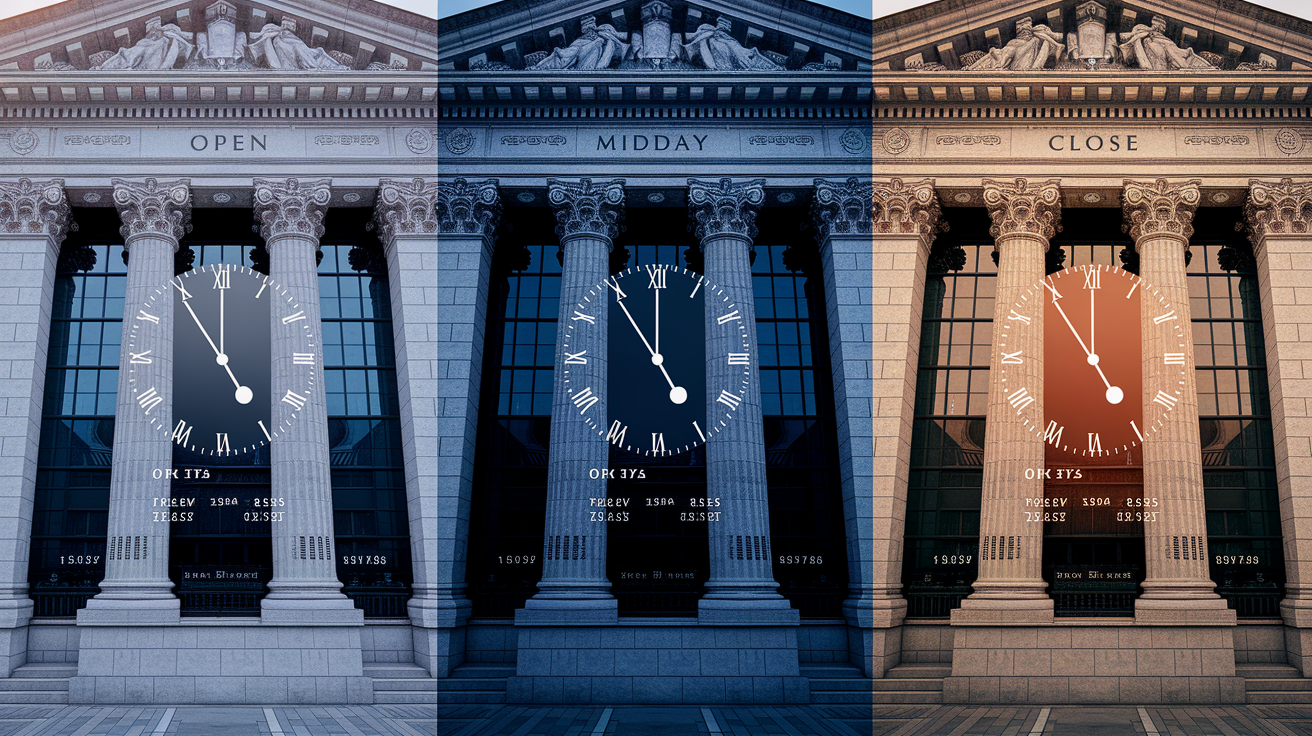
Institutional execution clusters around two windows: the opening thirty minutes and the closing thirty minutes. The open is when liquidity is deepest, thanks to the opening auction and the release of overnight order flow. Institutions prefer this window because they can execute size with less market impact. The result is outsized volatility and momentum at the open. Sharp moves, wide spreads, and large volume prints. If an institution is entering a new position, the open is often when the first aggressive leg appears. Retail traders who enter during this window need to account for elevated slippage and the risk that the initial spike fades once the opening flow subsides.
Midday, roughly from 11:30 AM to 2:00 PM Eastern, liquidity dries up and institutional activity slows. Volume declines, spreads tighten, and momentum often stalls or mean-reverts. This is when VWAP algos continue working quietly in the background, adding incrementally without creating visible spikes. For momentum traders, midday is typically a lower-probability window. Moves are smaller, follow-through is weaker, and false breakouts are more common. The exception is when a catalyst (earnings, news, sudden macro shift) arrives midday and forces institutions to react immediately.
The close brings another surge. Closing auctions concentrate liquidity, and institutions rush to complete benchmarked execution before the session ends. This is when you’ll see sustained buying or selling into the final minutes, often regardless of intraday price action. If an institution is behind on its VWAP target, it may aggressively buy into the close to improve the average fill price. Conversely, profit-taking and rebalancing flows can reverse intraday momentum sharply in the last thirty minutes. Pre-market and after-hours sessions show repositioning, but with far less liquidity, meaning smaller orders create larger price moves. Useful for reading sentiment, but risky for execution.
Time-based intraday momentum patterns:
Open volatility. The first thirty minutes typically see the largest volume and price swings, driven by overnight order flow, opening auction dynamics, and institutions establishing or adjusting positions with maximum liquidity.
Midday decay. From late morning through early afternoon, volume and volatility drop as institutional flow shifts to passive VWAP execution. Momentum often stalls, and intraday ranges compress.
Close-driven momentum. The final thirty minutes see renewed volume and volatility as institutions rush to complete benchmarked orders, closing auctions concentrate liquidity, and algos flatten positions, often producing sharp directional moves that may reverse the prior intraday trend.
Retail Reaction and Secondary Momentum Effects

Retail traders react to institutional moves, but usually with a lag. By the time a momentum spike appears on a scanner or breaks a technical level that retail monitors, the institution may already be several cents into the move. Retail then chases, buying into strength and providing the liquidity that allows the institution to continue executing, or to exit at favorable prices. This dynamic amplifies the initial move, but it also increases slippage for retail and creates conditions for a sharp reversal once the institutional buyer steps aside.
Misreading hidden-size execution is a common retail mistake. A stock might show repeated buying at a single price level, which looks like strong support. Retail interprets this as bullish and enters, not realizing it’s an iceberg order that’s nearly complete. Once the iceberg finishes, the support disappears, and price often drops quickly. Institutions are aware of this behavior and sometimes use it to their advantage, providing the liquidity for their own exit by attracting retail momentum chasers.
Behavioral differences also matter. Institutions typically add on pullbacks to VWAP or key support levels, scaling into positions over time. Retail tends to do the opposite, buying breakouts and selling dips, which means retail is often on the wrong side of the trade at turning points. When institutions pull back after a momentum run, retail is left holding, and the unwinding of those positions accelerates the reversal. Understanding this pattern helps traders avoid being the exit liquidity for a larger player.
Final Words
In the action: large institutional buys sweep liquidity, trigger volume spikes, widen spreads, and kick off intraday momentum.
The post walks through execution methods (VWAP/TWAP, icebergs), market microstructure patterns, VWAP cues, ignition and continuation mechanics, a block-trade example, time-of-day effects, and practical risk controls.
Knowing how institutional buying affects intraday momentum helps you spot footprints, size stops sensibly, and avoid late chased entries, so you trade with clearer signals and less slippage.
FAQ
Q: Why do 90% of day traders fail? Is it true that 97% of day traders lose money?
A: The high failure rates cited (90–97%) reflect that most retail day traders lose money because of poor risk control, high trading costs, lack of a repeatable edge, and emotional overtrading, so tighten risk and strategy to improve odds.
Q: What is the 3-5-7 rule in day trading?
A: The 3-5-7 rule in day trading is a simple risk guideline: risk about 3% per trade, cap weekly drawdown near 5%, and monthly near 7%, use it as a starting control and adjust by strategy.
Q: What is the 84% rule in trading?
A: The 84% rule in trading is not a universal law; it usually refers to a specific backtest or claim about win-rate or reversion probability, verify the data and context before applying it.