Is silver staging a real breakout, or just a short-lived spike traders will shake out?
Price is near two-month highs, holding above the 50-day exponential moving average (EMA50) and the simple moving average after a sharp May 12 move that flipped $82.95 from resistance to support.
That setup suggests the short-term trend is bullish, with pullbacks toward $82.95 offering cleaner risk/reward entries.
We’ll cover the key technical drivers, the fundamental demand story, and practical entry points to watch next.
Current Silver Market Conditions and Trend Overview

Silver’s trading near its highest levels in two months. The latest market update from 2026-05-15 06:25AM UTC shows the metal holding firm at its simple moving average after some profit-taking. Price action over the past week has confirmed a short-term bullish trend, with silver maintaining gains above both its 50-day exponential moving average (EMA50) and simple moving average, while successfully testing support near $82.95. That level used to act as resistance before getting breached in a sharp upward move on 2026-05-12.
The technical picture shows momentum indicators shifting through cycles of overbought and oversold conditions as the market digests recent gains. Relative strength readings moved into overbought territory during the surge above $82.95, then rotated toward oversold during pullbacks as traders locked in profits. Despite these intraday fluctuations, the underlying structure remains intact. Price continues to respect the upward trendline and the EMA50 acts as a reliable dynamic support zone. The $82.95 level has now flipped from resistance to a key pivot, reinforcing the shift in market structure. When silver first tested this level from below in early May, it faced selling pressure. After the breakout, the same zone attracted buyers on dips.
The short-term outlook favors continued bullish momentum as long as price holds above the EMA50 and the simple moving average. The formation of higher lows during recent pullbacks signals healthy consolidation rather than trend reversal. Traders are watching for confirmation of support on any retracement toward $82.95, which would offer a favorable risk/reward entry for continuation trades. The near-daily coverage and forecast updates between 2026-05-08 and 2026-05-15 reflect active monitoring of this developing trend phase, with analysts tracking whether the metal can sustain its two-month highs or if profit-taking will deepen.
| Timestamp | Key Market Note |
|---|---|
| 2026-05-15 06:25AM UTC | Latest page update; silver maintaining short-term bullish structure |
| 2026-05-15 01:45AM UTC | Intraday analysis: price finding support at simple moving average |
| 2026-05-12 (session) | Sharp surge breached key resistance at $82.95; level now pivotal support |
Technical Drivers Shaping the Silver Market Trend

The dominant technical driver behind silver’s current trend is the sustained trade above the 50-day exponential moving average. When price consistently holds above the EMA50, it suggests buyers are defending each pullback and treating dips as opportunities rather than warnings. Every test of the EMA50 since early May has resulted in a bounce, creating a pattern of higher lows that defines the upward trend. The simple moving average has also acted as a secondary layer of support, catching price when intraday selling pressure intensified.
Momentum indicators have oscillated through distinct phases during this rally. The relative strength index moved into overbought territory as silver surged above $82.95, signaling that the pace of buying was outstripping typical ranges. Rather than triggering an immediate reversal, the overbought condition persisted briefly before profit-taking brought RSI back toward neutral and then into oversold readings on the pullback. This rotation is a normal feature of trending markets and often precedes the next leg higher. The EMA50 remains the critical line in the sand. As long as price holds above it, the path of least resistance is upward.
The breakout above $82.95 on 2026-05-12 was a key technical event. This level had capped price for several sessions, creating a clear resistance zone that traders marked for potential breakout trades. When silver finally pushed through in a sharp move, it confirmed accumulation below resistance and triggered momentum buying. Since the breakout, the $82.95 zone has been retested from above and held as support, which is classic confirmation that the level has flipped. Price has since stabilized between this support floor and the next resistance targets, giving the market time to build energy for another move.
| Technical Indicator | Current Interpretation |
|---|---|
| EMA50 | Acting as dynamic support; price holding above confirms short-term bullish bias |
| Simple Moving Average | Secondary support layer; recent test held, reinforcing uptrend structure |
| RSI (Relative Strength Index) | Cycled from overbought (post-breakout) to oversold (profit-taking); now neutral, suggesting digestion phase |
| Resistance/Support Pattern | $82.95 flipped from resistance to support after May 12 breakout; higher-low formation intact |
Fundamental Factors Influencing Silver Market Trends

Industrial demand remains the primary fundamental driver for silver, with significant growth coming from solar panel manufacturing, electric vehicle production, and electronics. Solar installations alone account for a rising share of annual silver consumption as photovoltaic technology relies on silver paste for conductivity. Electric vehicles use more silver per unit than traditional cars due to increased electrical components, battery management systems, and charging infrastructure. Electronics demand spanning semiconductors, circuit boards, and consumer devices adds a steady baseline that grows with global tech adoption. When China reported higher inflation in May 2026, the market read it as a signal of recovering industrial activity, which typically boosts demand for industrial metals like silver and copper.
On the supply side, silver production is constrained by its nature as a by-product metal. Most silver comes from mines focused on extracting lead, zinc, copper, or gold, meaning silver output doesn’t respond quickly to price signals the way a primary metal might. If silver prices double, a lead-zinc mine doesn’t immediately ramp up production to chase silver revenue. It operates on the economics of its primary metal. This inelastic supply creates a structural tightness when demand accelerates. Mining companies have also faced permitting delays, labor shortages, and capital discipline that limit new project development, keeping a lid on medium-term supply growth.
Macroeconomic forces link silver to broader risk appetite and monetary policy. Interest rates directly affect the opportunity cost of holding non-yielding metals. When rates fall, silver becomes more attractive relative to bonds. The shift into a rate-cutting cycle starting in 2025 and continuing into 2026 has supported metals by lowering the hurdle rate for investment demand. Inflation readings matter because silver acts as a partial inflation hedge, particularly when industrial demand is strong. Economic activity indicators like purchasing managers’ indexes (PMIs) signal whether manufacturing sectors are expanding or contracting, which feeds directly into industrial silver consumption. Investment demand has also picked up, with exchange-traded fund (ETF) inflows reflecting renewed interest in precious metals as safe-haven assets during periods of geopolitical tension or fiscal uncertainty.
Historical Silver Price Patterns and Long-Term Trend Context
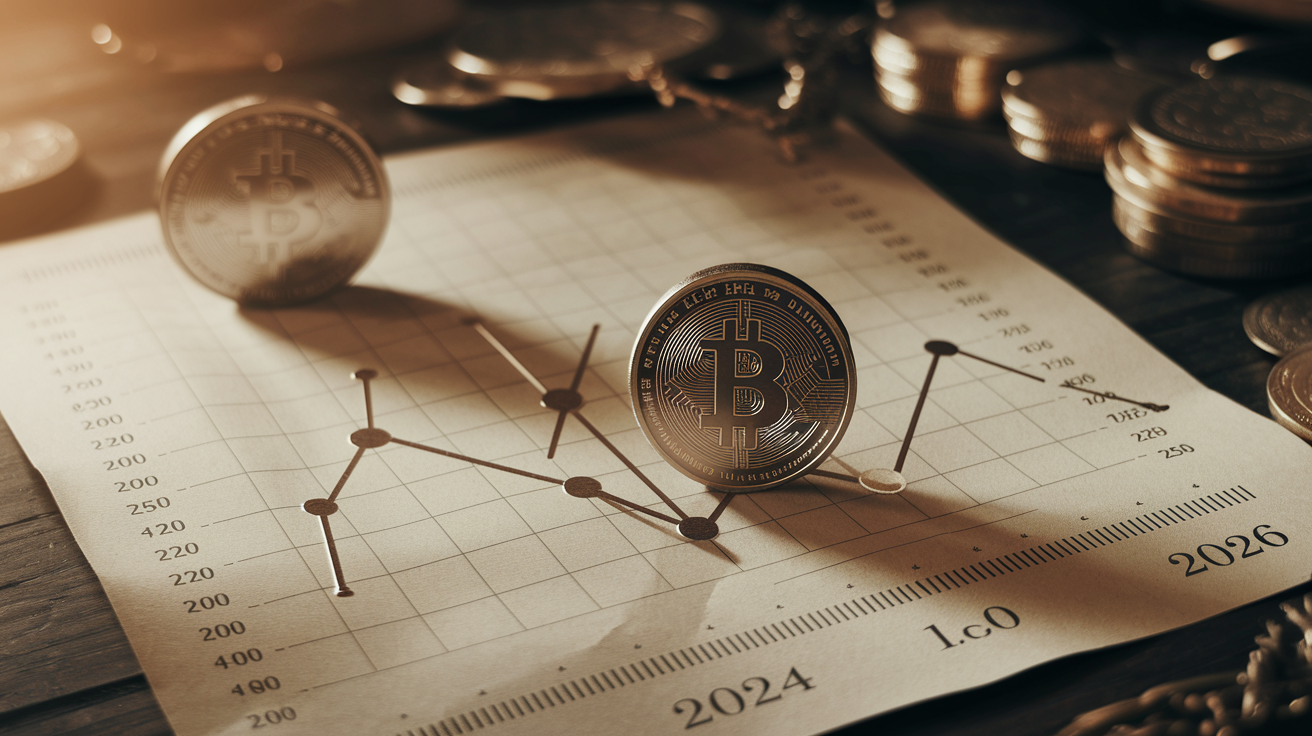
Silver’s multi-year price trajectory shows a sustained uptrend that began from a relatively subdued base in early 2024. For much of 2024, silver traded in a range of roughly $25 to $32 per ounce, closing just under $29 on December 31, 2024. This range represented a consolidation phase after earlier volatility, with price spending most of the year digesting previous moves and building a foundation for the next leg higher. The lack of major breakouts in 2024 kept the metal off most headline radars, but the technical base was forming as industrial demand quietly accumulated.
The 2025 trajectory marked a clear acceleration. Silver began the year near $29, rose to the mid-$30s by mid-2025, then surged from roughly $40 at the start of September to above $70 by late December. This late-year rally was fueled by a combination of industrial demand growth, a dovish shift in Federal Reserve policy, and renewed safe-haven interest as geopolitical tensions flared. The year-end close of $71.65 on December 31, 2025 set the stage for further gains into 2026. Early January 2026 saw silver consolidate briefly around $72.70 before pushing toward $80.90 by January 6, then continuing higher into the May 2026 levels near the two-month highs currently being tested.
Volatility patterns over this period have reflected both macro phases and liquidity conditions. The 2024 range-bound trade featured lower volatility as the market lacked a clear catalyst. The September to December 2025 surge brought elevated volatility as momentum buyers and hedgers clashed, creating wide intraday swings and frequent gap opens. The January 2026 session that printed an intraday range from $73.36 to $80.96 illustrates the kind of volatility that emerges when thin liquidity (post-holiday trade) meets strong directional momentum. Historical trend data helps forecast models by establishing the pace of prior rallies, the depth of pullbacks, and the technical levels that acted as pivots.
Key historical turning points:
2024 baseline: Silver consolidated in the $25 to $32 range for most of the year, setting the platform for the next rally phase.
Mid-2025 acceleration: Price broke out of the 2024 range and climbed into the mid-$30s, confirming a shift in trend direction.
Late-2025 breakout: The surge from $40 in September to above $70 by December marked the most explosive phase, driven by industrial demand, rate cuts, and safe-haven flows.
Early-2026 consolidation: After touching $80.90 in January, silver entered a choppy consolidation phase before resuming higher in May 2026 to test two-month highs.
Silver Correlations: USD, Gold, and Macro Cross-Market Signals

Silver’s relationship with the U.S. dollar typically runs inverse. When the dollar weakens, dollar-denominated commodities like silver become cheaper for foreign buyers, supporting price. But the 2026 rally has shown periods where silver moved higher despite a stable or even firmer dollar, suggesting that industrial demand and momentum flows were strong enough to override the usual currency drag. The analysis from May 2026 noted that metals were moving higher without confirming strength in gold, a decoupling from the usual pattern where gold leads and silver follows. This decoupling hints that silver’s industrial demand drivers are asserting themselves independently of monetary-metal dynamics.
The gold-to-silver ratio (how many ounces of silver it takes to buy one ounce of gold) offers another lens on silver’s relative value. When the ratio is high, silver is cheap relative to gold, and historically the ratio tends to compress during risk-on phases or when industrial demand outpaces investment demand. Interest rates remain a macro force that influences both metals, but silver’s industrial exposure makes it more sensitive to growth expectations than gold. When the Fed shifted toward rate cuts in 2025, both metals benefited, but silver’s rally was steeper because lower rates also signal economic support for manufacturing and technology sectors that consume silver. Geopolitical risk tends to boost gold more reliably, yet silver catches a bid when investors seek alternatives to traditional safe havens or when supply concerns in industrial metals spill over.
Cross-market effects on silver trend analysis:
Volatility amplification: Silver’s smaller market size relative to gold means moves can be more violent. Correlation breakdowns (like the May 2026 decoupling) often precede sharp directional shifts.
Trend confirmation: When silver and gold move together and the dollar weakens, the trend is typically more durable. When they diverge, watch for which driver (industrial vs. monetary) dominates.
Risk sentiment: In risk-off environments gold usually outperforms, but if industrial demand remains strong, silver can hold up better than its historical pattern would suggest.
Forecasts and Scenario Outlook for Silver Market Trends

Major institutional forecasts for silver in 2026 show a range of expectations, with most analysts projecting annual average prices in the mid-$50s to mid-$60s per ounce under baseline scenarios. One major bank lifted its 2026 peak outlook to roughly $65 per ounce, with a full-year average near $56.25. Another institution’s mid-2026 scenario pointed to around $55 per ounce. These projections were published before the May 2026 rally that took silver back toward the two-month highs, suggesting that realized prices could run above forecast averages if current momentum persists. The dispersion in forecasts reflects differing assumptions about how quickly industrial demand will grow, whether mining supply will expand, and how dovish central banks will remain.
Low, mid, and high scenario frameworks help capture the uncertainty. A low scenario typically assumes slower economic growth, weaker industrial demand (especially from China and solar sectors), and a supply response that brings more metal to market. In that case, prices might ease back toward the $40 to $50 range if the rally proves unsustainable. The mid scenario (where most bank forecasts cluster) assumes moderate demand growth, continued supply constraints, and a stable-to-easier monetary policy environment, supporting prices in the $55 to $65 band. A high scenario envisions strong energy-transition adoption, supply shocks (mine closures, geopolitical disruptions), and sustained investment inflows pushing silver toward $70 to $80 or higher. The May 2026 price action near $83 to $85 suggests the market is currently pricing elements of the high scenario.
Predictive models used by analysts range from econometric frameworks (regression models linking silver to GDP, manufacturing PMIs, interest rates, and the dollar) to machine-learning approaches that digest large datasets including sentiment indicators, options positioning, and cross-asset correlations. Econometric models offer transparency and scenario testing but can miss regime changes. Machine-learning models can capture non-linear relationships but are harder to interpret. Both approaches rely on historical patterns, so major structural shifts (like a surge in solar installations or a mining supply disruption) can quickly make forecasts obsolete. That’s why near-term technical updates (like the daily coverage from May 8 to 15, 2026) are essential for adjusting expectations in real time.
| Institution/Model | Forecast Range | Key Assumptions |
|---|---|---|
| Major Bank A | $56.25 average (2026), $65 peak | Moderate industrial demand growth, supply constraints, dovish Fed policy |
| Major Bank B | ~$55 mid-2026 | Stable macro, continued solar/EV adoption, limited mine supply response |
| Survey Consensus | Low-$30s to mid-$60s (wide range) | Depends on demand elasticity, supply shocks, monetary policy path |
| Machine Learning Model | Scenario-dependent: $40 to $80+ | Non-linear inputs including sentiment, positioning, cross-asset flows |
Market Sentiment, Positioning, and Trader Behavior in Silver Trends

Sentiment data from early January 2026 showed retail and CFD clients heavily skewed long, with 73% of open positions on the buy side versus 27% short. A net long skew of +46 percentage points signals crowded positioning, which can amplify moves in both directions. If the trend continues, shorts get squeezed and chase price higher. If it reverses, long liquidation can accelerate the selloff. This positioning snapshot matters because extreme sentiment often precedes volatility spikes. When the majority leans one way, the market becomes vulnerable to shifts in narrative or unexpected data that forces a reassessment.
Patterns in sentiment-driven volatility are visible in the recent price action. The RSI moving into overbought territory during the breakout above $82.95 reflected euphoric buying pressure, a classic setup for profit-taking. When that profit-taking arrived, RSI swung toward oversold, creating a reset that allows the trend to continue without overheating. The near-daily forecast updates from May 8 to 15 capture this rhythm: analysts noted the struggle to maintain gains on May 14, the rise on strong support on May 13, and the sharp surge on May 12. This kind of intraday volatility (where price oscillates between support and resistance within tight bands) often signals a market digesting positioning rather than fundamental news.
Key sentiment indicators traders watch:
Client long/short ratios: Extreme skews (like the 73/27 split) warn of potential squeezes or reversals. Contrarian traders fade the crowd when positioning gets too one-sided.
RSI overbought/oversold cycles: Rapid swings from overbought to oversold (and back) during trending phases indicate healthy consolidation rather than trend exhaustion.
Forecast update frequency: High-frequency coverage (near-daily updates) suggests active positioning and elevated interest, which tends to increase short-term volatility and create opportunities for nimble traders.
Actionable Insights for Interpreting Silver Market Trends

For traders and investors looking to act on current silver trends, the technical levels from the May 2026 analysis offer clear reference points. The $82.95 level is the key pivot. Holding above it confirms the bullish structure, while a sustained break below would signal a deeper pullback. Using the EMA50 and simple moving average as stop-loss anchors makes sense because these are the levels the market has repeatedly defended. A long position entered on a pullback to $81.50 to $82.00 (near the SMA and just below $82.95) would offer a tight stop below the EMA50, limiting downside risk while targeting the next resistance zone near $87 to $90. A buy-stop trigger above $87.00 is another approach. Waiting for momentum confirmation before entering sacrifices some upside but reduces the risk of catching a false breakout.
Integrating silver into a diversified portfolio using trend signals requires balancing the metal’s volatility with its diversification benefits. Silver’s correlation with equities is lower than many risk assets, making it a useful portfolio hedge during periods of market stress. When trend indicators align (price above moving averages, RSI cycling through healthy ranges, support levels holding), an allocation of 3% to 7% to silver can add uncorrelated return potential without dominating portfolio risk. The key is to size positions based on the strength of the trend signal and current volatility: tighter stops in a choppy market, wider targets when momentum is strong and resistance is distant.
Risk management and monitoring intervals are critical for silver, given the metal’s tendency for sharp intraday swings. Checking positions at least once per day during active trend phases allows traders to adjust stops and take partial profits if price reaches interim targets. For longer-term investors, weekly reviews of the technical picture (EMA50 slope, support/resistance tests, RSI trends) are usually sufficient. The most important rule is to respect the levels. If price breaks the stop, exit and reassess rather than hoping for a reversal. The May 2026 action shows how quickly silver can move (the May 12 surge through $82.95 in a single session), so having predefined levels and disciplined execution is non-negotiable.
Actionable steps for trend-based silver positioning:
Entry triggers: Buy on confirmed support at $81.50 to $82.00 (pullback entry near SMA and $82.95 pivot) or use a buy-stop above $87.00 for momentum continuation.
Stop placement: Set stops below the EMA50 (currently the key dynamic support) or below the $82.95 pivot if entering on a bounce. Adjust stops higher as the trend progresses to lock in gains.
Levels to watch: Immediate resistance near $87 to $90 (May 2026 targets). If breached, next targets are $92 to $97 (March 2026 highs) and psychological $100. Downside support is $82.95, then the EMA50, then $80 to $81.50 zone.
Trend confirmation signals: Sustained daily closes above the EMA50, RSI cycling without extended overbought/oversold extremes, and higher-low patterns on pullbacks all confirm the trend remains intact. A break below the SMA would be the first warning sign of a deeper correction.
Final Words
Price is trading near two-month highs after breaching $82.95, with the 2026-05-15 06:25AM UTC snapshot and a 2026-05-15 01:45AM UTC intraday highlight pointing to bullish short-term momentum.
EMA50 and SMA support are holding. RSI has cooled from overbought, and breakout dynamics have stabilized price. Fundamentals like industrial demand and limited supply reinforce the case.
This silver market trend analysis suggests the upside remains the path of least resistance; watch $82.95 as the pivot, $87 as a buy-stop trigger, and pullbacks to $81.50–$82.00 for cleaner entries. Overall, the near-term outlook is constructive.
FAQ
Q: Is silver expected to drop or rise?
A: Silver is expected to be short-term bullish but still range-bound; traders watch EMA50 support and $82.95 resistance—breach or failure will likely signal further rise or pullback.
Q: What is the 80 50 rule for silver?
A: The 80/50 rule for silver is a trader shorthand: price above $80 and the 50-day moving average implies bullish bias; below both suggests weakness and higher chance of deeper pullbacks.
Q: What does Warren Buffett say about silver?
A: Warren Buffett has said he generally avoids precious metals like silver because they don’t produce income; he prefers buying businesses and assets that generate cash flow over raw metals.
Q: What does Elon Musk say about silver?
A: Elon Musk has no steady public stance on silver prices; his comments focus more on industrial demand (EVs, electronics) where silver matters than offering price forecasts.