

Still judging performance on month-to-month swings?
The YoY Sales Growth Formula slices through seasonality and gives a clean percent change versus the same period last year.
It’s just (current − prior) ÷ prior × 100 — easy to do in Excel and takes minutes.
In this post we’ll show the exact three-step calculation, quick spreadsheet tricks, and how to read the number so you know if growth is real or just a calendar trick.
By the end you’ll be able to compare products, regions, or campaigns without guessing.
Core Breakdown of the YoY Sales Growth Formula
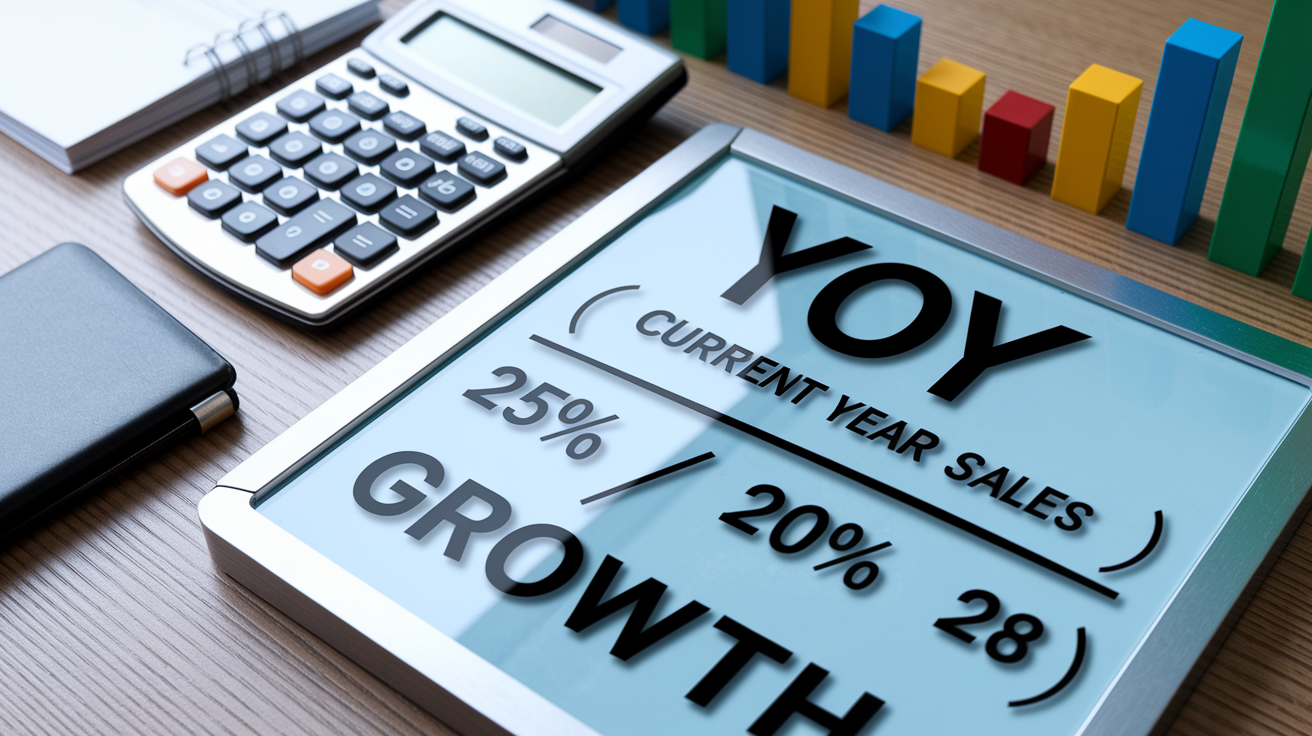
The year-over-year sales growth formula measures how much revenue moved up or down compared to the same stretch last year. Here’s the equation: ((Current Year Sales − Previous Year Sales) / Previous Year Sales) × 100. You get a percentage that shows growth or decline while cutting out seasonal weirdness by lining up identical windows exactly 12 months apart.
Running it is simple. Monthly revenue hits $50,000 this year versus $40,000 last year? That’s (($50,000 − $40,000) / $40,000) × 100 = 25 percent growth. Quarterly website traffic jumps to 30,000 pageviews from 25,000 a year ago: ((30,000 − 25,000) / 25,000) × 100 = 20 percent. For a quirky daily example, say July 4 net income lands at $1,756 this year compared to $1,288 last July 4. You’d calculate ((1,756 − 1,288) / 1,288) × 100 ≈ 36.3 percent growth. Same three steps every time, just different periods and scale.
Reading the result? Positive means sales grew. Negative means they shrank. Zero means flat. The size of the number tells you how fast things moved, which matters when you’re stacking up companies, products, or regions side by side.
Here’s the three-step process:
- Subtract last year’s number from this year’s to find the raw change.
- Divide that difference by last year’s figure to get the proportional shift.
- Multiply by 100 to turn it into a percentage.
Understanding Year-Over-Year Sales Growth Calculations

Year-over-year works for any matching period as long as you’ve got 12 months of data to compare. January 2025 versus January 2024, Q2 2025 against Q2 2024, even July 4, 2025 stacked against July 4, 2024. The trick is both slices represent the same timeframe, one year apart, so you’re not mixing apples and oranges.
Take a monthly case. March 2025 sales come in at $150,000, while March 2024 delivered $120,000. Plug it in: (($150,000 − $120,000) / $120,000) × 100 = 25 percent year-over-year growth for March. That single number tells you how the month performed relative to its prior-year twin, stripping out the seasonal bumps that would mess up a month-to-month view.
When you’re applying YoY across different windows, remember:
- Match the same period. Compare identical months, quarters, or calendar days from one year to the next.
- You need at least 12 months of history. Anything shorter won’t give you a true year-over-year picture.
- Monthly YoY catches short cycles with seasonal smoothing. Quarterly YoY irons out intra-quarter noise but still captures seasonal swings.
- Daily YoY fits special events. Holiday rushes, product drops, or one-off promo days benefit from daily year-on-year checks to see how the event actually performed.
Applying the YoY Sales Growth Formula in Real Scenarios

Setting this up in a spreadsheet takes seconds. Drop current-year sales in cell B2, previous-year sales in C2, then type =((B2−C2)/C2)*100 into D2. The result pops up as a decimal until you format it as a percentage, which both Excel and Google Sheets handle with one click.
Format to two decimal places for clean reporting. If you land on 0.2534, round it to 25.34 percent or just 25 percent, depending on what your team prefers. Skip the over-precision in public dashboards. Most execs care about direction and rough size, not the third decimal.
Templates and automation save time on repeat calculations. Build a simple table that auto-fills the formula for each row, whether you’re tracking monthly revenue, quarterly user counts, or annual contract values. Lots of finance teams use shared Google Sheets or Excel files with pre-built YoY columns that refresh as new numbers roll in.
| Input Values | Formula Example | Output (%) |
|---|---|---|
| Annual: $1,200,000 vs $1,000,000 | =((1200000−1000000)/1000000)*100 | 20.00 |
| Monthly: $50,000 vs $40,000 | =((50000−40000)/40000)*100 | 25.00 |
| Daily: $1,756 vs $1,288 | =((1756−1288)/1288)*100 | 36.34 |
Interpreting YoY Sales Growth and What the Results Mean

Reading the number is only half the work. A 10 percent year-over-year bump tells you sales are climbing, but whether that’s impressive or weak depends on context. A SaaS startup hitting 10 percent might be lagging if peers are pulling 30 percent. A mature grocery chain posting 10 percent in a flat market? That’s solid.
Industry benchmarks matter. In stable sectors like utilities or consumer staples, 5 percent YoY can signal strong execution and market-share wins. In fast-moving categories like EVs or fintech, 20 percent might be baseline, and anything under that raises eyebrows about competitive position or market saturation. Always stack your result against peer companies, historical patterns, and broader economic signals like GDP or inflation.
Visualization helps you catch turning points. Plot YoY growth on a line chart across multiple periods to spot acceleration, slowdown, or steady state. Toss in a moving average (say, a three-month rolling average of monthly YoY) to smooth out spikes and reveal the real trend. Color-coded conditional formatting in spreadsheets makes positive and negative swings jump out instantly, speeding up exec reviews and board decks.
YoY vs MoM vs QoQ: Choosing the Right Growth Metric
Month-over-month growth compares the current month to the one right before it: ((Current Month − Previous Month) / Previous Month) × 100. MoM catches short-term shifts and is great for spotting sudden changes in demand, but it’s jumpy and gets wrecked by seasonality. If August always trails July, MoM will show a drop even when the business is healthy on a year-over-year basis.
Quarter-over-quarter uses the same setup but looks at sequential quarters: ((Current Quarter − Previous Quarter) / Previous Quarter) × 100. QoQ sits between MoM and YoY in time horizon. It’s handy for tracking momentum inside a fiscal year and for industries where quarterly earnings drive stock moves. QoQ still carries some seasonal quirks, especially if Q4 always crushes Q1, but it’s less noisy than MoM.
When to use each:
- Use YoY when you need to kill seasonality and assess long-term health. Best for annual planning, investor decks, and peer benchmarking.
- Use MoM when monitoring near-term moves like new campaigns, price tweaks, or product launches. Expect volatility and read it carefully.
- Use QoQ for medium-term trend spotting and quarterly biz reviews. It balances speed with some seasonal smoothing, though not as much as YoY.
Advanced Adjustments for Accurate YoY Sales Growth

Seasonality adjustments come into play when comparing periods with irregular rhythms. Retail outfits often deseasonalize data by applying seasonal factors (multipliers pulled from multi-year averages) before running YoY growth. This isolates the real trend from predictable holiday spikes or summer slumps, giving you a clearer read on actual performance versus calendar effects.
Inflation adjustments flip nominal sales into real (constant-dollar) terms, especially during high-inflation stretches. If prices jumped 5 percent and your nominal YoY growth is 8 percent, real growth sits closer to 3 percent. Currency swings also mess with YoY comparisons for global companies. Reporting “constant currency” growth, where you restate prior-year revenue at current exchange rates, cuts out FX noise and zeroes in on operational performance. Acquisitions, divestitures, and accounting shifts need similar fixes to keep comparisons clean.
Handling edge cases stops you from publishing nonsense. If last year’s sales were zero (new product or market launch), the YoY percentage is mathematically broken because you’re dividing by zero. In that case, report the absolute dollar gain instead of a percentage, or frame it as “new revenue of $50,000” rather than claiming infinite growth.
Steps to consider for tougher adjustments:
- Deseasonalize data with seasonal indices if you’re comparing mismatched periods or building forecasts.
- Apply inflation or deflator indices to show growth in real terms, especially across multiple years.
- Restate prior-year numbers at current FX rates for constant-currency reporting in global ops.
- Exclude one-time events (mergers, store closures, regulatory hits) that skew the baseline or current period.
Multi-Year Growth Methods: CAGR and Rolling YoY
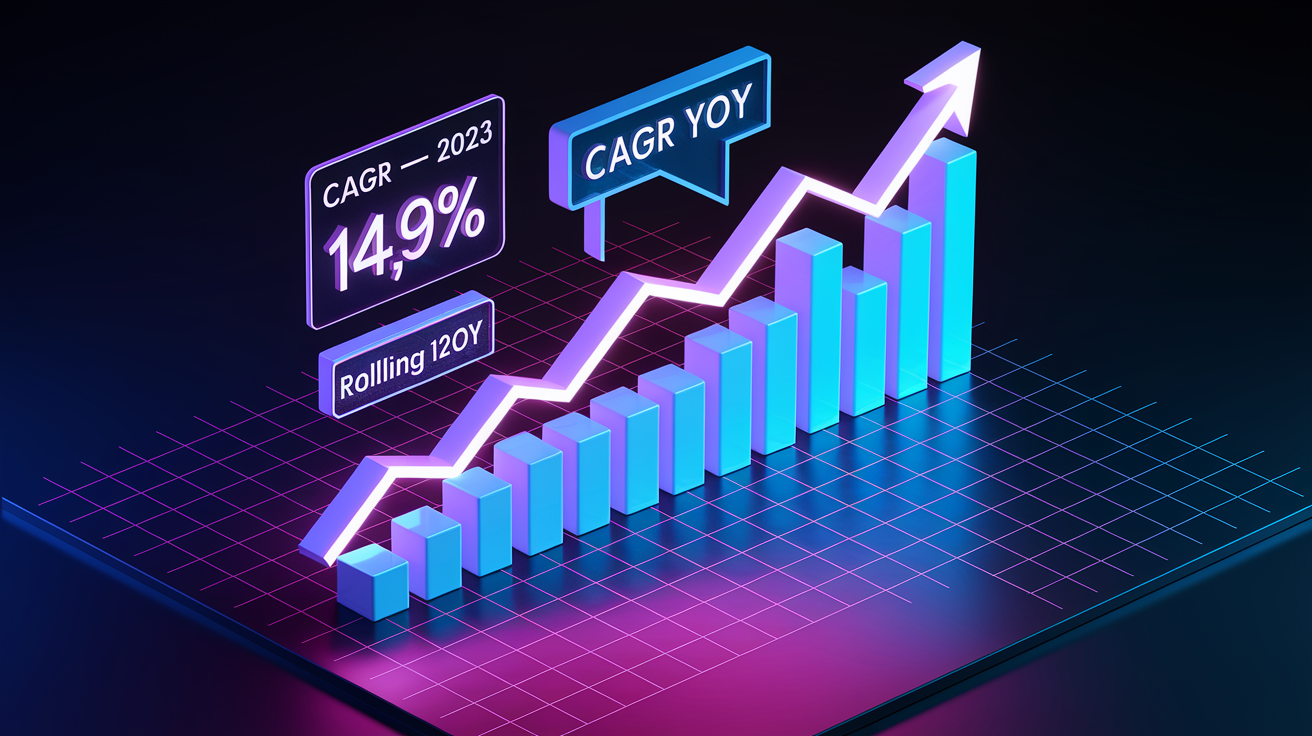
When you’re tracking performance over several years, the compound annual growth rate (CAGR) gives you a smoothed average that accounts for compounding. Formula is (Ending Value / Beginning Value)^(1 / Number of Years) − 1. Sales grew from $500,000 in 2018 to $1,000,000 in 2023? That’s five years. CAGR = (1,000,000 / 500,000)^(1/5) − 1 = 2^(0.2) − 1 ≈ 0.1487, roughly 14.87 percent annualized. CAGR is less jumpy than single-year YoY because it averages out the peaks and valleys across the whole stretch.
Rolling 12-month YoY (also called trailing-twelve-months or TTM) updates the window every month by comparing the most recent 12 months to the prior 12. This smooths seasonal spikes and gives you a constantly refreshed view of year-over-year performance without waiting for calendar year-end. Rolling YoY works well for businesses with uneven monthly patterns or for mid-year reviews where you want the latest full-year snapshot.
| Metric | Purpose |
|---|---|
| YoY | Compares same period across two consecutive years; removes seasonality. |
| CAGR | Smooths multi-year growth into an average annual rate; useful for long-term trends. |
| Rolling 12M YoY | Continuously updated trailing-twelve-months comparison; balances timeliness and smoothing. |
| Multi-Year Trend Index | Normalizes all periods to a base year (e.g., 2020 = 100); visualizes cumulative change over time. |
Factors Influencing YoY Sales Growth

Pricing shifts can fuel YoY growth without any lift in unit volume. Raise prices 10 percent and keep unit sales flat? Revenue climbs 10 percent year-over-year purely from pricing power. On the flip side, heavy discounts or promos might boost unit volume but squeeze revenue per transaction, flattening or even cutting YoY growth despite higher customer counts.
Product mix changes alter average transaction value and total revenue. Launch a premium line or kill off low-margin SKUs and the sales composition shifts. If high-margin items grow faster than low-margin ones, overall revenue YoY accelerates even when total units sold hold steady. Channel mix also matters. Direct-to-consumer often carries higher margins and faster growth than wholesale, so a pivot toward DTC can lift YoY growth independently of total market demand.
Distribution and market expansion create step changes in YoY comparisons. Opening new geographies, adding retail partners, or launching on new platforms (Amazon, international marketplaces) can produce big YoY jumps that reflect expansion rather than same-store performance. Splitting out organic growth (same locations, same channels) from inorganic growth (new locations, acquisitions) clarifies whether the business is gaining traction in existing markets or just getting bigger through geographic spread.
Five big drivers of YoY sales growth:
- Pricing strategy: bumps or cuts in average selling price per unit.
- Volume changes: more or fewer units sold, driven by demand, marketing, or competition.
- Product mix: shifts toward pricier or cheaper items in the portfolio.
- Channel mix: changing slices of sales across DTC, wholesale, e-commerce, or physical retail.
- Market expansion: new geographies, new customer segments, or new distribution deals.
Using YoY Sales Growth in Forecasting and Business Planning

Year-over-year trends anchor long-term forecasts because they filter out seasonal chop and spotlight sustainable growth rates. If your business has logged 15 percent YoY for three straight years, that’s a solid baseline for next year’s budget, tweaked for known headwinds or tailwinds like new product drops, economic cycles, or competitive moves. YoY stability makes it easier to model revenue scenarios and set realistic targets for sales teams and marketing budgets.
Dashboards and KPIs built on YoY metrics give execs a quick pulse check without wading through monthly swings. A single tile showing “Q1 2025 Revenue: +18% YoY” carries more strategic weight than “March Revenue: +3% MoM,” because the YoY figure bakes in seasonality and delivers a clearer signal about underlying momentum. Most finance dashboards stack YoY growth alongside absolute revenue, margin trends, and customer acquisition costs to paint a full performance picture.
Three forecasting techniques guided by YoY trends:
- Baseline projection: Start with trailing 12-month YoY growth, then layer in known shifts (price hikes, new markets, product exits) to tweak the forecast up or down.
- Scenario analysis: Model optimistic (say, +25% YoY), base-case (+15% YoY), and pessimistic (+5% YoY) scenarios using historical YoY ranges and external signals like GDP forecasts or industry reports.
- Rolling reforecasts: Update the YoY baseline every quarter as fresh data lands, adjusting the full-year outlook based on the latest rolling 12-month performance and any shifts in market conditions or internal execution.
Final Words
You learned the exact equation: ((Current Year Sales − Previous Year Sales) / Previous Year Sales) × 100, the three-step method, and worked examples ($50,000 vs $40,000 = 25%; $30,000 vs $25,000 = 20%; $1,756 vs $1,288 = 36.3%).
We covered interpretation (positive = growth, negative = decline, zero = no change), timeframe rules, Excel/Sheets syntax, and common adjustments like seasonality and base-year issues.
Use the yoy sales growth formula as a quick check in reports and forecasts, and keep iterating—small improvements add up.
FAQ
Q: How to calculate yoy sales growth?
A: The YoY sales growth is calculated as ((Current Year Sales − Previous Year Sales) / Previous Year Sales) × 100. Steps: subtract previous year, divide by previous year, then multiply by 100 to get percent.
Q: What is yoy sales growth?
A: YoY sales growth is the percent change in sales versus the same period last year, showing whether revenue rose, fell, or stayed flat after accounting for seasonality and timing.
Q: What is a good yoy sales growth rate?
A: A good YoY sales growth rate depends on the industry: about +5% is solid for mature sectors, while +20% or more is typical for high-growth markets; context matters for interpretation.
Q: Is yoy growth the same as CAGR?
A: YoY growth is not the same as CAGR. YoY compares one period to the prior year; CAGR (compound annual growth rate) smooths growth across multiple years, removing yearly volatility.