

Think moving average crossovers are just lagging noise that miss every big move?
They’re only useless when you treat them as standalone alerts.
Used right, with sensible period pairs, the right MA type for your timeframe, and quick confirmations like RSI, MACD, and volume, crossovers become a clean way to confirm that a trend has actually shifted.
This post lays out the exact setups, period combos, and simple filters that cut false signals and help you spot real trend confirmation without overtrading.
Core Explanation of Moving Average Crossovers

A moving average crossover happens when a shorter-period moving average crosses above or below a longer-period moving average on a price chart. The faster line reacts quickly to recent price changes. The slower one smooths out longer-term trends. When they intersect, traders see it as a potential shift in momentum or trend direction.
The basic logic is simple. When the short-term moving average crosses above the long-term moving average, recent price action is strengthening relative to the longer trend. Traders usually view this as a bullish signal. When the short-term moving average crosses below the long-term average, recent prices are weakening. That’s typically interpreted as bearish. The crossover doesn’t predict future price movement, but it confirms something changed in the relationship between short-term and long-term trend behavior.
Traders use crossovers to identify entry and exit points, confirm trend changes, and filter out random noise in price action. The strategy works best in markets that develop clear trends, because the moving averages need sustained directional movement to produce reliable signals. In sideways or choppy markets, crossovers generate frequent false signals as the averages cross back and forth without meaningful follow-through.
Primary signals and interpretations from moving average crossovers:
- Bullish crossover – short MA crosses above long MA, suggesting upward momentum and a potential buy signal.
- Bearish crossover – short MA crosses below long MA, suggesting downward momentum and a potential sell signal.
- Trend confirmation – price staying consistently above both MAs supports an uptrend. Staying below both supports a downtrend.
- Dynamic support and resistance – moving averages often act as price levels where trends pause or reverse.
- Lag indicator – crossovers arrive after price has already started moving, so they capture the middle of trends rather than exact tops or bottoms.
Types of Moving Averages Used in Crossover Strategies
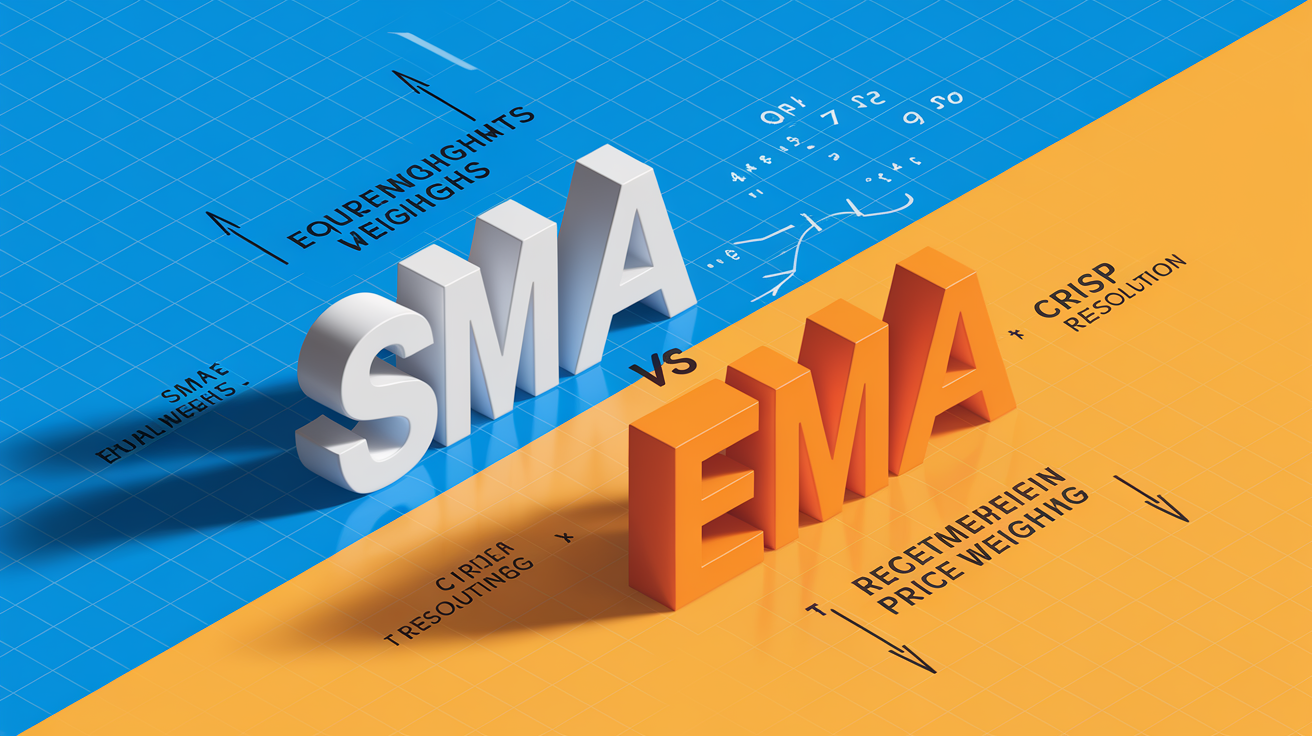
The two most common moving average types in crossover strategies are the simple moving average (SMA) and the exponential moving average (EMA). Both calculate an average price over a set number of periods, but they weight the data differently. This changes how quickly they respond to new price information.
A simple moving average gives equal weight to every price in the lookback period. If you use a 20-period SMA, each of the last 20 closing prices contributes exactly 5 percent to the final average. This equal weighting produces a smooth line that filters out short-term noise. But it also means the SMA reacts slowly to sharp price changes. The oldest price in the calculation carries the same weight as the most recent one, so sudden moves take time to fully show up in the line.
An exponential moving average applies a multiplier that gives more weight to recent prices. The weighting factor is calculated as 2 ÷ (n + 1), where n is the number of periods. For a 20-period EMA, the multiplier is 2 ÷ 21, about 9.5 percent. That means the most recent price contributes nearly 10 percent to the average, and older prices decay exponentially. This makes the EMA more responsive to fresh data, which helps traders spot trend changes earlier but also increases sensitivity to short-term volatility.
| Moving Average Type | Key Characteristics | Best Use Case |
|---|---|---|
| Simple Moving Average (SMA) | Equal weight to all periods; smoother line; slower reaction to price changes | Long-term trend confirmation; daily or weekly charts; reducing noise in volatile markets |
| Exponential Moving Average (EMA) | Greater weight to recent prices; faster reaction; more sensitive to new data | Short-term and intraday trading; faster entry signals; swing trading on hourly or 4-hour charts |
Choosing Effective Moving Average Period Combinations

The choice of period lengths directly affects how quickly crossovers occur and how much noise they filter. Shorter period combinations produce more signals. Longer combinations smooth out price action and reduce false crossovers at the cost of slower reaction times.
For short-term trading and scalping, pairs like 9/21 or 10/30 are common. A 9-period moving average hugs price closely, crossing a 21-period average frequently enough to capture intraday or short swing moves. These fast pairs work well on 5-minute to 1-hour charts when markets are trending. But they generate many whipsaws during consolidation.
Mid-term swing traders often use 20/50 period combinations on 1-hour, 4-hour, or daily charts. The 20-period MA responds to multi-day trends without excessive noise. The 50-period MA provides a stable reference for the longer trend. This pairing balances responsiveness and reliability, making it a practical default for traders holding positions from a few days to a few weeks.
Long-term position traders and investors rely on the 50/200 crossover, often called the “Golden Cross” (bullish) or “Death Cross” (bearish). This pairing filters out short-term volatility and confirms major trend shifts that can last months or years. The 50/200 crossover on a daily chart is widely watched across equities, forex, and commodities. But it lags significantly and will miss early entry points.
Pros and cons of different moving average pairings:
- 9/21 or 10/30 (short-term) – Pro: fast signals, captures short trends. Con: high false signal rate in choppy markets, requires active monitoring.
- 20/50 (mid-term) – Pro: balanced speed and noise filtering, works across multiple timeframes. Con: still vulnerable to whipsaws during sideways action.
- 50/200 (long-term) – Pro: strong confirmation of major trends, low signal frequency. Con: significant lag, misses early entries, unsuitable for short-term trading.
- EMA pairs vs SMA pairs – Pro (EMA): faster reaction, better for dynamic markets. Con (EMA): more noise, requires tighter filters.
Identifying Bullish and Bearish Crossovers
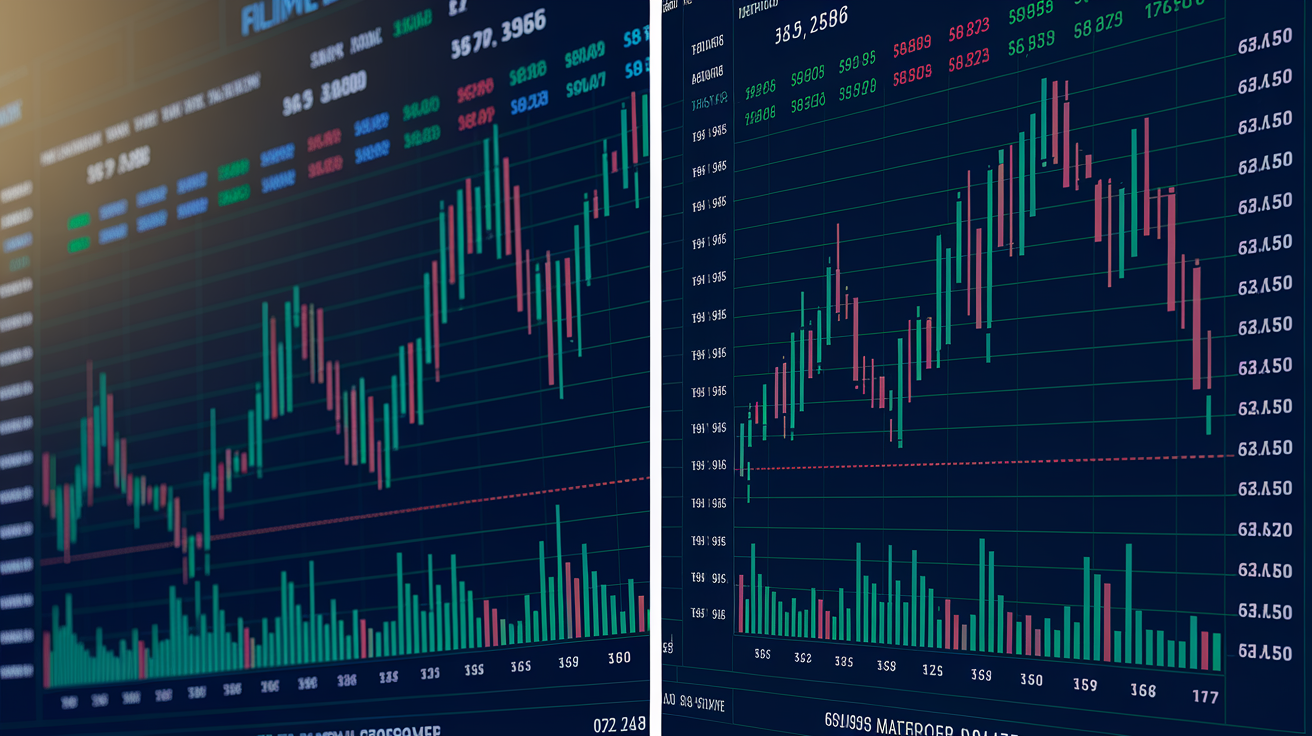
A bullish crossover forms when the faster moving average crosses from below to above the slower moving average. Visually, you see the short MA rising through the long MA, often accompanied by an increase in price momentum. This pattern suggests that recent price behavior is strengthening relative to the longer-term trend. Traders interpret it as a buy signal or confirmation that an uptrend is starting.
A bearish crossover occurs when the faster moving average crosses from above to below the slower moving average. The short MA falls through the long MA, signaling that recent prices are weakening compared to the longer trend. Traders use this pattern as a sell signal or confirmation that a downtrend is developing. The key is the direction of the cross and the slope of both lines after the intersection. If the faster MA continues moving away from the slower MA after the cross, the signal gains strength.
Volume and market structure add context. A bullish crossover accompanied by rising volume and a break above a recent resistance level is more reliable than a crossover during low-volume consolidation. Similarly, a bearish crossover near a breakdown of support, with volume increasing, often leads to stronger follow-through than a crossover in the middle of a range.
Five steps to visually identify crossovers on a chart:
- Plot both moving averages on your chosen timeframe. For example, a 20-period EMA and a 50-period EMA on a 4-hour chart.
- Watch for the point where the two lines intersect. The exact candle where the cross occurs is your signal candle.
- Confirm direction by checking which moving average is now on top. If the faster MA is above the slower MA, the crossover is bullish. If below, it’s bearish.
- Observe the slope of both moving averages after the cross. A widening gap between the two lines indicates strengthening momentum in the direction of the cross.
- Check volume on the signal candle and the candles immediately after. Volume at least 1.5 times the recent average suggests the crossover has participation and is less likely to reverse quickly.
Using Additional Indicators to Confirm Crossover Signals

Moving average crossovers work better when paired with indicators that measure momentum, trend strength, or overbought and oversold conditions. Relying on a crossover alone increases the risk of entering trades during false breakouts or weak trends that quickly reverse.
The Relative Strength Index (RSI) helps confirm whether a crossover aligns with underlying momentum. For a bullish crossover, traders look for RSI above 50, indicating positive momentum, or RSI moving out of oversold territory (below 30) and rising. An RSI reading above 70 suggests overbought conditions, which can weaken the reliability of a bullish crossover because the market may be due for a pullback. For bearish crossovers, RSI below 50 or falling from overbought levels adds confirmation.
The Moving Average Convergence Divergence (MACD) is itself based on moving averages and provides a secondary momentum view. The MACD line is the difference between a 12-period EMA and a 26-period EMA, and the signal line is a 9-period EMA of the MACD line. When the MACD line crosses above the signal line around the same time as a bullish moving average crossover, it confirms strengthening momentum. A rising MACD histogram (the difference between MACD and signal) adds further weight. For bearish crossovers, a MACD line crossing below the signal line or a histogram falling toward zero supports the downside signal.
Volume is one of the most practical confirmation tools. A crossover that occurs on a candle with volume significantly higher than the recent average (1.5 to 2 times normal volume) indicates that the price move has conviction. Low volume crossovers often fail because they reflect positioning by a small number of participants rather than broad market agreement. If volume stays elevated in the candles following the crossover, the signal is more likely to lead to a sustained trend.
When confirmation indicators provide strong support:
- RSI confirmation – RSI greater than 50 and rising for bullish crossovers. RSI less than 50 and falling for bearish crossovers. Extra strength if RSI is exiting oversold or overbought zones in the direction of the crossover.
- MACD confirmation – MACD line crossing signal line in the same direction as the MA crossover, or histogram expanding in the direction of the trend. Divergence between MACD and price can also warn of weakening signals.
- Volume confirmation – Volume on the crossover candle at least 1.5 times the recent average, with sustained volume in the following candles. Rising volume during the crossover candle and declining volume on pullbacks supports trend continuation.
Timeframe Selection and Its Impact on Crossover Reliability

The timeframe you choose determines how many crossover signals you receive and how much noise you filter. Shorter timeframes like 5-minute or 15-minute charts produce frequent crossovers, which can be useful for scalpers and day traders looking for quick entries. The downside is that these signals often reverse within a few candles, especially during low volatility periods or when the market is ranging.
Longer timeframes like the daily or weekly chart reduce the number of signals but increase reliability. A 20/50 crossover on a daily chart filters out intraday noise and confirms multi-day or multi-week trends. The 50/200 crossover on a daily chart is a widely followed long-term signal that often marks the start of major bull or bear markets. But it lags significantly and won’t catch early entries.
Many traders use multiple timeframes to align their signals. For example, they may require the daily chart to show a bullish 50/200 crossover before taking any long trades on the 1-hour chart using a 20/50 crossover. This higher timeframe filter reduces false signals by ensuring that short-term entries align with the broader trend. The trade off is fewer opportunities, but the opportunities that do appear tend to have better follow-through and risk to reward profiles.
Chart Examples Illustrating Crossover Behavior

In a clean trending market, a bullish crossover often appears near the start of an uptrend. The short-term moving average crosses above the long-term moving average, and both lines begin sloping upward. Price stays above both moving averages for an extended period. Pullbacks tend to bounce near the faster moving average, which acts as dynamic support. Volume typically rises on the initial breakout and remains elevated during the trend.
In a sideways or choppy market, crossovers become unreliable. The short-term moving average crosses back and forth over the long-term moving average multiple times within a narrow price range. Each crossover looks like a valid signal, but price fails to follow through, producing small losses or breakeven trades. Volume often remains low and inconsistent during these periods, and the moving averages flatten out rather than trending up or down.
What traders should look for in crossover chart behavior:
- Clear separation after the cross – the faster MA should move away from the slower MA and stay separated for multiple candles, indicating sustained momentum rather than a brief spike.
- Volume confirmation on the signal candle – the crossover candle should show volume at least 1.5 times the recent average, suggesting broad participation rather than random noise.
- Price action respecting the moving averages – in a valid trend, price should pull back to the faster MA and bounce, using it as support (uptrend) or resistance (downtrend), rather than crossing back and forth through both lines.
Real World Trading Scenarios Using Moving Average Crossovers

In trending equity markets, a 50/200 crossover on the daily chart often signals the start of a multi-month move. During the 2020 recovery, many stocks showed Golden Crosses in the second quarter after the March lows. Those crossovers preceded sustained rallies into 2021. Traders who waited for the crossover missed the initial bounce but captured the middle and late stages of the trend with reduced risk of early whipsaws.
In forex, a 20/50 crossover on the 4-hour chart can confirm short-term trend shifts driven by central bank policy changes or economic data releases. For example, a currency pair showing a bullish 4-hour crossover after an interest rate hike, combined with rising RSI and volume, often leads to a multi-day trend as positioning adjusts. Forex markets trade continuously, so crossovers can occur overnight. Traders need to monitor multiple sessions or use alerts.
In cryptocurrency markets, volatility is higher, and crossovers on shorter timeframes generate frequent signals. A 9/21 EMA crossover on the 1-hour chart can capture intraday swings, but traders must use wider stops (3 to 8 percent) to avoid being stopped out by normal price noise. Crossovers in crypto are most effective during periods of clear directional bias, such as when Bitcoin breaks out of a multi-week consolidation with volume. During low volatility periods, crossovers produce whipsaws, and traders often pause the strategy or switch to longer timeframes.
Common Pitfalls and How to Avoid False Signals

The most common pitfall is taking crossover signals during sideways or range bound markets. When price oscillates within a horizontal channel, the moving averages cross repeatedly without meaningful follow-through. Each crossover looks valid on its own, but the lack of trend structure means most signals fail. Traders who enter every crossover without checking market context rack up small losses that erode capital.
Another mistake is ignoring the slope and separation of the moving averages after the cross. A crossover where the two moving averages remain close together and nearly flat often indicates weak momentum. A reliable crossover should show the faster MA pulling away from the slower MA with both lines sloping in the direction of the trend. If the gap narrows quickly after the cross, the signal is likely to reverse.
Methods to reduce false signals from moving average crossovers:
- Filter with trend strength indicators – use ADX (Average Directional Index) and only take crossover signals when ADX is above 25, confirming a trending market rather than a range. ADX below 20 suggests consolidation, and crossovers in that environment are unreliable.
- Require volume confirmation – wait for the crossover candle to show volume at least 1.5 times the recent average. Low volume crossovers often lack follow-through and reverse quickly.
- Align with higher timeframes – confirm that the crossover on your trading timeframe matches the trend direction on a higher timeframe. For example, only take bullish 1-hour crossovers when the daily chart shows price above its 50-period moving average.
- Use price structure as a filter – take bullish crossovers near support or after a break of resistance, and bearish crossovers near resistance or after a break of support. Crossovers in the middle of a range or without nearby structure are lower probability.
Step by Step Workflow for Implementing a Crossover Strategy

Implementing a moving average crossover strategy requires clear rules and consistent execution to avoid emotional trading and overreaction to noise.
- Select your trading timeframe – choose the timeframe that fits your schedule and risk tolerance (5-minute for scalping, 1-hour or 4-hour for swing trading, daily for position trading).
- Choose your moving average pair – pick periods based on your horizon (9/21 or 10/30 for short-term, 20/50 for mid-term, 50/200 for long-term). Decide whether to use SMA or EMA based on desired responsiveness.
- Wait for a confirmed crossover – the faster MA must fully cross the slower MA and close on the opposite side. Avoid acting on intracandle crosses that reverse before the close.
- Check higher timeframe alignment – confirm that the trend on the next higher timeframe supports your signal direction. If the daily trend is down, skip bullish crossovers on the 1-hour chart.
- Validate with secondary indicators – require at least one confirmation from RSI, MACD, or volume before entering. For example, RSI greater than 50 for bullish crossovers or volume at least 1.5 times average on the signal candle.
- Calculate position size and set stop loss – risk 1 to 2 percent of account equity per trade. Place your stop below the recent swing low (for long trades) or below the slower moving average, whichever is closer and allows for normal volatility.
- Set initial target and trailing rules – aim for a reward to risk ratio of at least 2 to 1. Consider trailing your stop using a shorter moving average (such as a 9-period EMA) to lock in gains as the trend develops, and exit when price closes below that trailing MA.
Final Words
You walked through what moving average crossovers are, why traders pick SMA vs EMA, and which period pairs work for short, medium, and long trends. We covered how to spot bullish and bearish crossovers, add RSI/MACD and volume for confirmation, and read timeframes and chart examples.
You also saw common pitfalls and a simple step‑by‑step workflow to use in practice.
Use the checklist, paper‑trade a few setups, and focus on how to use moving average crossovers to confirm market trends. It gets clearer with repetition.
FAQ
Q: How do you use moving averages to confirm trends and determine trend with two moving averages?
A: Using moving averages to confirm trends means checking a fast MA against a slow MA: a fast MA above a slow MA with both sloping up suggests a bullish trend; the reverse suggests bearish.
Q: How to use moving average crossover strategy?
A: The moving average crossover strategy uses a short MA crossing a long MA as buy/sell signals: pick periods, wait for a clean crossover, confirm with momentum or volume, and use stops to limit risk.
Q: What is the 3-5-7 rule in trading?
A: The 3-5-7 rule in trading refers to using three very short EMAs (exponential moving averages) — 3, 5, and 7 periods — for quick trend signals; traders act when all three align.