

What if your product launch depended more on a spreadsheet than intuition?
Nearly two-thirds of serious marketers now trust data over gut instinct, and that’s the point.
This post walks through real case studies with numbers, from a real estate team that turned CRM signals into $2.3M to a retailer that used smoothing to avoid mistaking holiday spikes for decline.
Read this if you want clear, repeatable steps to spot trends, strip seasonality, and act before the market moves.
Practical Market Trend Analysis Example Walkthrough

Market trend analysis uses historical data to figure out if prices, demand, or engagement are going up, down, or stuck. Nearly two-thirds of serious marketers now trust data over gut instinct, and real examples turn abstract theory into something you can actually repeat. The goal? Pull directional signals from raw numbers and use them to time product launches, move capital around, or shift positioning before the market does it for you.
DreamHome Realty’s process shows how a real estate firm turned spreadsheets into decisions. They set concrete targets: 12 percent market-share gain, 150 new clients, $2.3 million in extra revenue. Data came from industry reports, competitor open houses, customer surveys, and their CRM. They ran Porter’s Five Forces to check competitive pressure and a SWOT to map strengths against risks. CRM analytics and predictive metrics pointed to unmet rental demand in a suburban corridor, so they tweaked pricing tiers and built personas for renters instead of only buyers. Final output was an investor deck with tables, charts, and a one-page exec summary.
To calculate an actual trend from price and volume series:
- Collect daily or weekly data: closing prices, trade volume, site visits, sales units. Record dates in a spreadsheet.
- Plot raw points as a line chart to see the overall shape and catch spikes or crashes.
- Apply a moving average (10-day, 50-day, or 200-day window) to smooth out noise and show the real slope.
- Read direction. If price stays above the moving average and volume climbs, you’ve got a bull trend. If price drops below on rising volume, it’s bearish. If price bounces around a flat average, it’s sideways.
- Summarize in one sentence and flag the catalyst: earnings beat, regulatory shift, seasonality, whatever kicked it off.
Real equity example: a mid-cap software stock bounced between $42 and $46 for six months, then broke above $48 on heavy volume after a product launch. The 50-day moving average crossed the 200-day two weeks later, confirming the shift from sideways to uptrend. Analysts who caught that crossover got in before the next leg to $54.
Time-Series Market Trend Analysis Examples Using Smoothing Methods

Smoothing techniques cut through short-term chop to reveal if the underlying direction is up, down, or flat. Moving averages are the easiest: you average the last n periods at each point. Exponential smoothing weights recent data harder, so it reacts faster when momentum flips. Both help traders and analysts separate signal from noise, especially when daily swings are wild but the medium-term path holds steady.
An e-commerce retailer watched daily website traffic swing hard every November and December thanks to Black Friday and holiday shopping. Raw daily traffic hit 85,000 on Cyber Monday, crashed to 22,000 by mid-January, then crawled back to 30,000 through spring. A 30-day moving average flattened the holiday spike and showed steady 4 percent quarterly growth underneath. Seasonal decomposition split the series into trend (slow climb), seasonal component (November–December spikes), and residual noise. Without smoothing, the analyst would’ve mistaken the January drop for structural decline instead of a predictable post-holiday hangover.
Four smoothing outputs worth tracking:
- Trend line: the long-term slope after you strip out seasonal and random junk.
- Seasonally adjusted line: raw data minus the seasonal pattern, showing real growth or contraction.
- Rolling mean window: a moving average that shifts forward one period at a time, good for live dashboards.
- Decomposition trend component: the output of an additive or multiplicative model that isolates the multi-quarter direction.
Decomposing Trends vs. Seasonality in a Market Trend Analysis Example
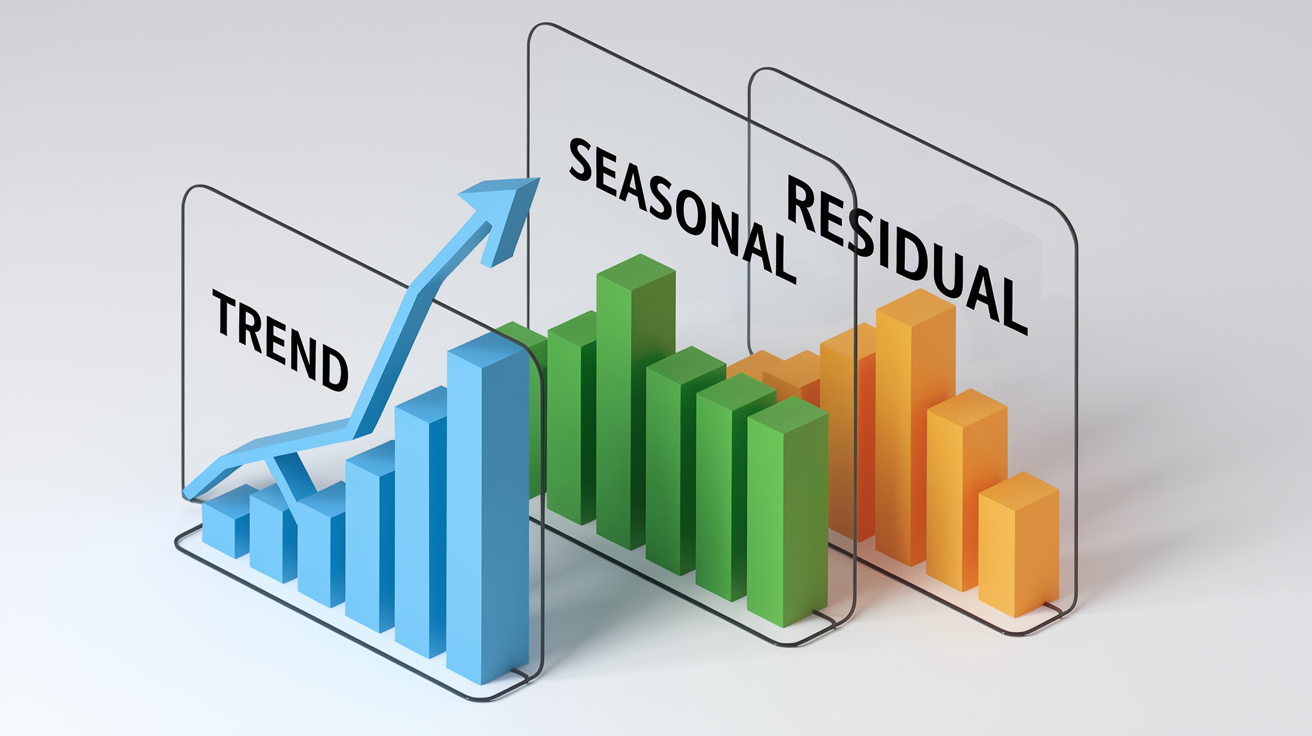
Decomposition splits a time series into three pieces: trend (the long-term direction), seasonal (repeating calendar patterns), and residual (random noise). The trend component tells you if the business is growing, shrinking, or stuck. The seasonal piece shows which months or quarters always spike or dip. The residual is what’s left: one-off events like a supply hiccup or a viral tweet. Confusing seasonality with real growth is a classic mistake. A November sales spike might look like momentum but vanish by February.
A baby-clothing retailer tracked monthly revenue and noticed December sales were 2.8 times the January baseline. Decomposition showed that gifting behavior (friends and grandparents buying for new parents) drove the December surge, not a sustained demand shift. The trend component clocked 6 percent annual growth, the seasonal index for December was 2.8×, and the residual sat near zero most months except for a March outlier when a celebrity endorsement created a temporary bump. The analyst adjusted inventory planning to stock heavy in Q4 but avoided over-ordering in Q1, saving cash and warehouse space.
Cyclical trends run over multiple years. Demand for luxury goods rises and falls with economic cycles. Secular trends persist across decades, like the shift from print to digital. Decomposition helps you tell the difference: if the trend component keeps climbing even after you remove seasonal effects, it’s probably secular. If it oscillates with a multi-year period, it’s cyclical. Analysts compare the isolated trend to macro indicators like GDP growth or interest rates to confirm which type they’re seeing.
Cross-Market Trend Analysis Examples: Stocks, Crypto, Commodities

Trend analysis works across asset classes, but each market has its own fingerprint. Stocks follow earnings cycles and central-bank moves. Crypto runs on sentiment, regulatory headlines, and exchange flows. Commodities react to supply shocks, weather, and geopolitical drama. Comparing trends across markets reveals risk appetite. When equities and crypto rally together, it signals broad risk-on sentiment. When gold and bonds rise while stocks fall, it’s a flight to safety.
Equity Trend Example
A large-cap tech stock started a bull trend in early 2025 after a flat 2024. Price moved from $118 to $142 over four months, staying above the 50-day moving average the whole time. Volume spiked on up days and dried up on pullbacks, confirming buyer conviction. The trend held until the stock broke below the 50-day average on heavy volume in late Q2, signaling a shift to sideways or bearish. Analysts who waited for the volume confirmation dodged false breakouts and timed entries near support around $120.
Cryptocurrency Trend Example
Bitcoin moved sideways between $38,000 and $44,000 for six weeks, then broke out to $52,000 after a spot ETF approval headline. Classic consolidation followed by sentiment-driven breakout. Volume doubled on the breakout day, and on-chain data showed large wallets accumulating during the sideways phase. The trend went parabolic, gaining 30 percent in three weeks, then entered a steep correction when retail sentiment peaked. Crypto trends are faster and wilder than equities, so analysts use shorter moving averages (7-day and 21-day) and track social-media sentiment in real time.
Commodity Trend Example
Crude oil traced a cyclical pattern from 2023 to 2026, rallying when OPEC cut production and falling when U.S. shale output rose. The trend peaked at $92 per barrel in mid-2024, then dropped to $68 by early 2025 as recession fears cut demand forecasts. Gold, a safe-haven asset, moved inversely during the same stretch, falling when risk assets rallied and spiking to new highs when equities sold off. Analysts layered oil-price trends with inventory data (weekly EIA reports) and gold trends with real-yield movements (10-year TIPS yield) to predict turning points.
Regression and Correlation Market Trend Analysis Example

Regression fits a line through historical data points to estimate the slope and direction of a trend. Positive slope means the variable’s rising over time. Negative slope means it’s falling. The R-squared value tells you how much of the variation the trend line explains. An R² above 0.80 means the trend is strong and consistent. Below 0.30 suggests noise dominates and the trend is weak or nonexistent. Analysts use regression to forecast next quarter’s revenue, estimate market-share changes, or test if a new marketing channel is actually driving growth.
Correlation measures how two variables move together, but it doesn’t prove causation. A consumer-goods company found that Google search volume for its brand correlated 0.91 with monthly sales, so the marketing team treated search volume as a leading indicator. But when a competitor launched a similar product, search volume stayed flat while sales dropped, showing that correlation broke down under new competitive pressure. Lesson: test correlations across different conditions and don’t build strategy on a single metric.
KPI benchmarking uses industry averages to check performance. An e-commerce site had a bounce rate of 68 percent, well above the category average of 52 percent, signaling a UX or page-speed issue. After redesigning the landing page and compressing images, bounce rate fell to 49 percent and conversion rate jumped 1.3 percentage points. Solid data sources include the U.S. Bureau of Labor Statistics for employment and wage trends, Forrester for digital adoption forecasts, and Think with Google for consumer search and intent data.
| KPI | Metric | Purpose |
|---|---|---|
| Market Share (%) | Your revenue ÷ total market revenue | Track competitive position over time |
| CAGR (%) | Compound annual growth rate | Estimate multi-year trend slope |
| Traffic Channel Mix (%) | Direct / Organic / Social / Email | Reveal marketing-channel strength |
Anomaly, Outlier, and Noise Handling in Market Trend Analysis Examples

Data quality determines how reliable any trend analysis is. Missing data points create gaps that throw off moving averages, and outliers (single-day spikes or crashes) can trigger false signals if you don’t spot and handle them. Analysts clean datasets before plotting by checking for duplicate entries, filling short gaps with interpolation, and flagging anomalies that fall more than two standard deviations from the mean. Once flagged, investigate each outlier: was it real (earnings surprise, supply shock) or a data error (reporting glitch, bot traffic)?
A SaaS company saw daily active users jump from 12,000 to 47,000 on a single Wednesday, then revert to 12,500 the next day. Investigation revealed a bot attack that inflated login counts but generated zero revenue. The analyst removed that day from the trend calc and added a filter to exclude IP ranges tied to bots. Without cleaning, the moving average would’ve shown false growth, and forecasts would’ve overestimated next quarter’s user base by 15 percent.
Four common outlier causes to check:
- Holiday effects: Black Friday, Cyber Monday, or end-of-quarter sales pushes that spike volume.
- Sudden media spikes: a viral post, press mention, or influencer feature that drives one-time traffic.
- Bot or scraper traffic: automated requests that inflate web analytics without real user intent.
- One-off promotions: a 50 percent discount or giveaway that pulls future demand forward, creating a temporary surge and a dip after.
Market Trend Analysis Example for Retail and E‑Commerce

Retail and e-commerce trends get shaped by seasonality, product life cycles, and customer behavior shifts. Online traffic surges during Q4 holidays, dips in January, and climbs again in spring as tax refunds hit. Product launches follow a predictable arc: rapid growth in the first few months, a plateau as early adopters tap out, and a slow decline unless the brand refreshes features or pricing. Analysts combine website analytics, review sentiment, and purchase-intent data to detect when a product’s moving from growth to maturity.
A bamboo baby-clothing brand analyzed 800 customer reviews and found two recurring themes: parents praised the fabric’s softness and cited relief for babies with eczema, and a big chunk of buyers were gift-givers (friends and grandparents), not the parents themselves. That insight shifted the marketing target from new parents to gift occasions (baby showers, first birthdays) and opened a B2B channel selling to maternity stores. Traffic-channel data showed 42 percent Direct (repeat buyers and word-of-mouth), 31 percent Organic (SEO for “eczema-safe baby clothes”), 18 percent Social (Instagram ads targeting gift-givers), and 9 percent Email. The brand doubled down on SEO and Instagram, cutting spend on generic Facebook ads that weren’t converting.
Product life-cycle trend detection starts with plotting monthly unit sales and revenue. A sharp upward slope indicates growth phase. A flattening curve signals maturity. A downward slope means decline. Overlay search-volume trends and review velocity (number of new reviews per week) to confirm the stage. If search volume’s rising but sales are flat, price or availability might be the bottleneck. If reviews slow to a trickle, the product’s saturated its addressable market.
Three signals to track in retail trend analysis:
- Traffic-channel trend: rising Organic share indicates SEO momentum. Rising Direct share signals brand strength and repeat purchases.
- Review sentiment over time: declining star ratings or increasing complaints about quality, shipping, or support flag operational issues.
- Purchase-intent behavior: cart-abandonment rate, time between first visit and conversion, and coupon-redemption rate reveal pricing sensitivity and urgency.
Dashboard and Visualization Market Trend Analysis Example

Dashboards condense complex datasets into visual snapshots that execs and analysts can scan in seconds. The best trend dashboards combine line charts (to show direction over time), KPI cards (current vs. prior-period metrics), and heatmaps (to reveal patterns across segments or geographies). Every visual should answer a specific question: Is revenue growing? Which product category’s driving that growth? Are we gaining or losing share in key markets?
A growth-stage fintech built a live trend dashboard that tracked daily signups, activation rate (percentage who completed onboarding), and 30-day retention. The main panel showed a line chart with a 7-day moving average overlaid on raw daily signups, revealing that signups spiked on Tuesdays and Wednesdays (when email campaigns dropped) but retention was highest for users who signed up on weekends. A second panel displayed a traffic-channel heatmap: organic search drove 48 percent of signups, paid social 29 percent, referrals 15 percent, and email 8 percent. The team shifted budget toward organic content and weekend campaign timing, lifting 30-day retention from 61 percent to 68 percent over two quarters.
Four visualization types that clarify trend insights:
- Line charts with moving averages: show raw volatility and smoothed direction on the same plot.
- Heatmaps: display KPIs across time (rows = weeks, columns = days) to spot weekly or daily patterns.
- Decomposition charts: stack trend, seasonal, and residual components in separate panels for clear interpretation.
- KPI card layouts: headline metric (current value), sparkline (mini trend chart), and change indicator (percent up or down vs. prior period).
Forecasting Models: ARIMA and Prophet Market Trend Analysis Example

ARIMA (AutoRegressive Integrated Moving Average) and Prophet are time-series forecasting models that project future values based on historical patterns. ARIMA works well for data with clear autocorrelation (where today’s value depends on yesterday’s) and requires you to specify lag order, differencing, and moving-average terms. Prophet, developed by Meta, is simpler to configure and handles seasonality and holidays automatically, making it popular for business forecasting when you want a quick, interpretable output without deep statistical tuning.
An ARIMA example: a subscription-software company modeled monthly recurring revenue (MRR) from January 2023 to December 2025 and forecast the next six months. The model used a (1,1,1) configuration (one autoregressive term, one differencing step to remove trend, and one moving-average term) and produced a forecast with 95 percent confidence intervals. Point estimate for June 2026 was $487,000 MRR, with a confidence band from $461,000 to $513,000. Actual June MRR came in at $492,000, well within the interval, validating the model. Prophet handled a similar forecast but automatically detected the end-of-quarter spike in new subscriptions, improving accuracy by 8 percent compared to ARIMA.
Validation is critical. Backtest the model by training on data up to month t, forecasting months t+1 through t+6, then comparing predictions to actuals. Calculate mean absolute percentage error (MAPE) and check if the confidence intervals contain actual values 95 percent of the time. If errors are large or intervals are too wide, adjust model parameters, add external regressors (like marketing spend or macro indicators), or switch to an ensemble approach that averages multiple models.
Four-step model-validation checklist:
- Split data into training (80 percent) and test (20 percent) sets.
- Fit the model on training data and generate forecasts for the test period.
- Calculate MAPE and check confidence-interval coverage (should be close to the stated confidence level, e.g., 95 percent).
- Refit on the full dataset only after test-set performance checks out, then forecast the next period.
End-to-End Market Trend Analysis Example Using Mixed Methods

A full trend analysis combines quantitative data (time series, regression, KPIs), qualitative insights (customer reviews, interviews, sentiment analysis), and strategic framing (exec summary, recommendations, implementation steps). The output is a report or deck that execs can use to decide whether to enter a market, launch a product, or shift resources. Mixed methods reduce blind spots. Numbers show what is happening, and qualitative research explains why.
Executive Summary Example
Lego discovered that only 9 percent of its primary users were female, so it launched a four-year study with 3,500 girls and their mothers. The research revealed design preferences (pastel colors, modular buildings, character-driven play) that differed from traditional brick sets. Lego launched the “Friends” line in 2012, which doubled first-year sales expectations and tripled sales to girls within 12 months. By 2022, “Friends” remained one of the top-earning product themes. Bombardier, a business-aircraft manufacturer, publishes a 20-year market forecast covering 2011 to 2030 and uses data from 5,000 aircraft in service to establish authority and guide long-term R&D investment. Peloton grew from a Kickstarter to 37 offices across the U.S., U.K., Canada, and Germany, driven mostly by organic growth. SimilarWeb data showed low reliance on paid search, signaling strong product-market fit and word-of-mouth momentum.
Methodology Example
The analyst team collected CAGR estimates from market-research reports, scraped search-volume data from Google Trends and keyword tools, and analyzed competitor website traffic using traffic-analytics platforms. They tracked VC funding rounds and amounts from Crunchbase and PitchBook, and monitored hiring trends by counting new job postings on LinkedIn and company career pages. To gather qualitative data, they ran targeted surveys at roughly $1 per response, using screening questions like “Have you purchased product X in the past six months?” to filter respondents. One-on-one interviews with 15 customers revealed that gifting behavior (buying for friends’ babies) was a primary use case, which wasn’t obvious from sales data alone. The team also pulled 600 product reviews, tagged pain points, and ran sentiment analysis to track changes over time.
Strategic Recommendations Example
Based on the findings, the team recommended three actions. First, adjust pricing tiers to capture both budget-conscious buyers (entry SKU at $24) and premium customers (deluxe SKU at $58), avoiding the middle where competition was heaviest. Second, shift the product mix toward the rental-property segment, which showed 18 percent quarter-over-quarter growth compared to 6 percent in owner-occupied housing. Third, avoid entering the HTC First scenario: a social-media-centric phone that launched in 2013 at $99, then dropped to $0.99 within months due to poor pre-launch validation. Instead, the team proposed a beta landing page to collect pre-orders and measure real purchase intent before committing to full production. If 500 signups converted at a 12 percent deposit rate within four weeks, green-light the build. If conversions fell short, pivot or kill the project.
Final Words
In the action we walked through a complete, practical market trend analysis: definitions, the DreamHome Realty workflow, smoothing and decomposition, cross-asset cases, regression and anomaly handling, dashboards, forecasting, and an end-to-end case study.
You saw concrete steps for plotting price and volume, applying moving averages and Prophet, spotting seasonal spikes, and validating models with backtesting.
This market trend analysis example is a reusable template—clean data, clear visuals, and simple validation to turn insights into action. Use it as a starting point; small, consistent steps move the needle.
FAQ
Q: How to do a market trend analysis?
A: A market trend analysis is done by defining scope and goals, collecting price/sales/volume data, cleaning it, applying smoothing or regression, then interpreting direction, drivers, and risks for actionable insights.
Q: What are some examples of trend analysis?
A: Some examples of trend analysis include price and volume trends in equities, sales seasonality in retail, web-traffic smoothing, moving-average crossovers, and regression of demand versus macro indicators like interest rates.
Q: What are the 4 types of trends?
A: The four types of trends are uptrends (sustained gains), downtrends (sustained losses), sideways or range-bound trends, and cyclical/seasonal trends that repeat with economic or calendar cycles.
Q: Can ChatGPT do trend analysis?
A: ChatGPT can help with trend analysis by explaining methods, generating code, summarizing datasets you provide, and suggesting interpretations, but it can’t fetch live data or run models without supplied data and tools.