

Do higher interest rates hurt some stocks far more than others?
They do. When central banks lift rates, the discount rate climbs and future profits are worth less today.
That hits growth stocks hardest because their value lives in distant years, while value stocks with near-term earnings and dividends tend to hold up better thanks to sector mix and current cash flow; the speed and reason for hikes decide how quickly capital rotates between growth and value.
Core Market Mechanics Behind Rate Hikes and Stock Categories

When central banks raise interest rates, they’re changing the math investors use to value stocks. A company’s stock price equals the present value of all future cash flows, discounted back to today using the cost of capital. That cost includes the risk-free Treasury rate plus a credit spread. When the Treasury rate rises, the discount rate climbs, and present values fall.
Here’s what that looks like in numbers. Say a business will generate $1 million per year for ten years. At a 5 percent discount rate, that stream is worth roughly $7.7 million today. Raise the discount rate to 8 percent, and the present value drops to about $6.7 million. Same cash flows. Just worth less because the hurdle rate rose. Growth stocks feel that compression hardest since they pack most of their expected earnings far into the future. Value stocks, with nearer-term earnings and dividends, carry less duration risk and experience smaller hits.
This isn’t abstract theory. During the Fed’s 2022–2023 hiking cycle (rates went from near zero to above 5 percent), growth-heavy indexes like the Nasdaq sold off much faster than the Dow, which has more value and industrial exposure. Higher rates compress price-to-earnings multiples, especially for high-P/E names whose valuations rely on long-dated projections.
Here are the core transmission channels:
Discount rate. Higher rates directly reduce the present value of future cash flows, especially those many years out.
Cost of capital. Borrowing to fund expansion becomes more expensive, slowing growth companies that rely on debt.
P/E compression. Rising rates raise the required return, forcing multiples lower for high-growth firms.
Bond competition. As Treasury yields climb, fixed-income becomes more attractive, pulling capital away from speculative equities.
Sector exposure. Growth is concentrated in tech and consumer discretionary. Value tilts toward financials, energy, staples, and healthcare.
Investors expect these mechanics to play out in familiar patterns. When rates start climbing, capital rotates out of long-duration growth and into shorter-duration value and income plays. The speed of the rate move matters. A gradual rise tied to stronger economic growth can support earnings expansion that partially offsets valuation pressure. A sharp spike driven by inflation or policy surprise tends to trigger sudden rotations and broad volatility.
Growth Stock Sensitivity to Rising Interest Rates

Growth companies like Amazon, Tesla, and Nvidia derive most of their value from earnings expected years or even decades in the future. When discount rates rise, those distant cash flows lose value fast. A company expecting rapid revenue growth but thin near-term profits relies on investors’ willingness to pay for far-out expectations. Higher rates shrink the present value of that distant upside.
Financing costs matter too. Growth firms often burn cash to fund expansion, hiring, product development, and market share gains. They borrow to bridge the gap. When rates jump (say, from 3 percent to 6 percent), the interest on a $100 million loan doubles, directly squeezing margins and slowing the pace of investment. That slowdown reduces the actual earnings growth that justified the premium valuation in the first place.
History shows the pattern clearly. During the Dot-Com bust of 1999–2000, the Fed raised rates into a speculative tech bubble. The Nasdaq fell nearly 80 percent as growth stocks with no near-term profits collapsed. In early 2022, when the Fed began its aggressive hiking cycle, the Nasdaq declined roughly two to three times as fast as the Dow through the spring. Growth stocks simply carry more rate sensitivity because of their duration profile and reliance on cheap capital.
| Company Type | Rate Sensitivity Factor | Typical Outcome |
|---|---|---|
| High-growth tech | Long-duration cash flows, high P/E | Larger valuation declines, P/E compression |
| Unprofitable growth | Heavy reliance on debt or equity financing | Cash flow squeeze, expansion slowdown |
| Cyclical growth | Moderate duration, sector-specific demand | Mixed; depends on economic strength vs rate speed |
Value Stock Performance During Higher Rates

Value stocks (think Johnson & Johnson, Coca-Cola, Bank of America) trade on current earnings, steady cash flow, and often reliable dividends. Because their value is concentrated in near-term results rather than distant projections, the discounting effect of higher rates hits them less hard. A dividend paid next quarter doesn’t lose much present value when rates tick up a percentage point. A profit stream expected in 2035 does.
Sector composition reinforces this resilience. Value indexes tilt toward financials, consumer staples, healthcare, energy, and industrials. Financials in particular can benefit when rates rise, because banks earn wider net interest margins. They pay depositors less than they charge borrowers, and the spread often expands during hiking cycles. Energy and industrials benefit if rate hikes reflect strong economic demand rather than pure inflation fear.
During the 2022–2023 Fed tightening, value indexes held up better and in many periods outperformed growth. Investors rotated into dividend-paying defensive names and sectors less reliant on long-duration cash-flow stories. Bond yields rose, making income from stocks more competitive with fixed income, and value’s higher dividend yields helped cushion volatility.
Value stocks typically share these characteristics, which reduce rate sensitivity:
Shorter-duration cash flows. Earnings and dividends are realized sooner, limiting present-value compression.
Lower P/E ratios. Less reliance on future growth expectations means less multiple compression risk.
Stronger current profitability. Many value names generate free cash flow today, reducing the need for external financing.
Sector positioning. Exposure to financials, staples, and energy sectors that can benefit from or withstand higher rates.
Historical Rate-Hike Cycles and Their Impact on Growth vs Value Leadership
Early 2000s Dot-Com Example
The Fed raised rates into 1999 and 2000 as the internet bubble inflated. Growth stocks, especially unprofitable tech names trading on hype and distant revenue projections, soared into early 2000. When the bubble burst and rates stayed elevated, the Nasdaq cratered nearly 80 percent from peak to trough. Traditional value sectors (banks, industrials, consumer staples) fell much less. Investors learned that long-duration speculative bets collapse fastest when the cost of capital rises and sentiment reverses.
Gradual vs Rapid Hike Cycles
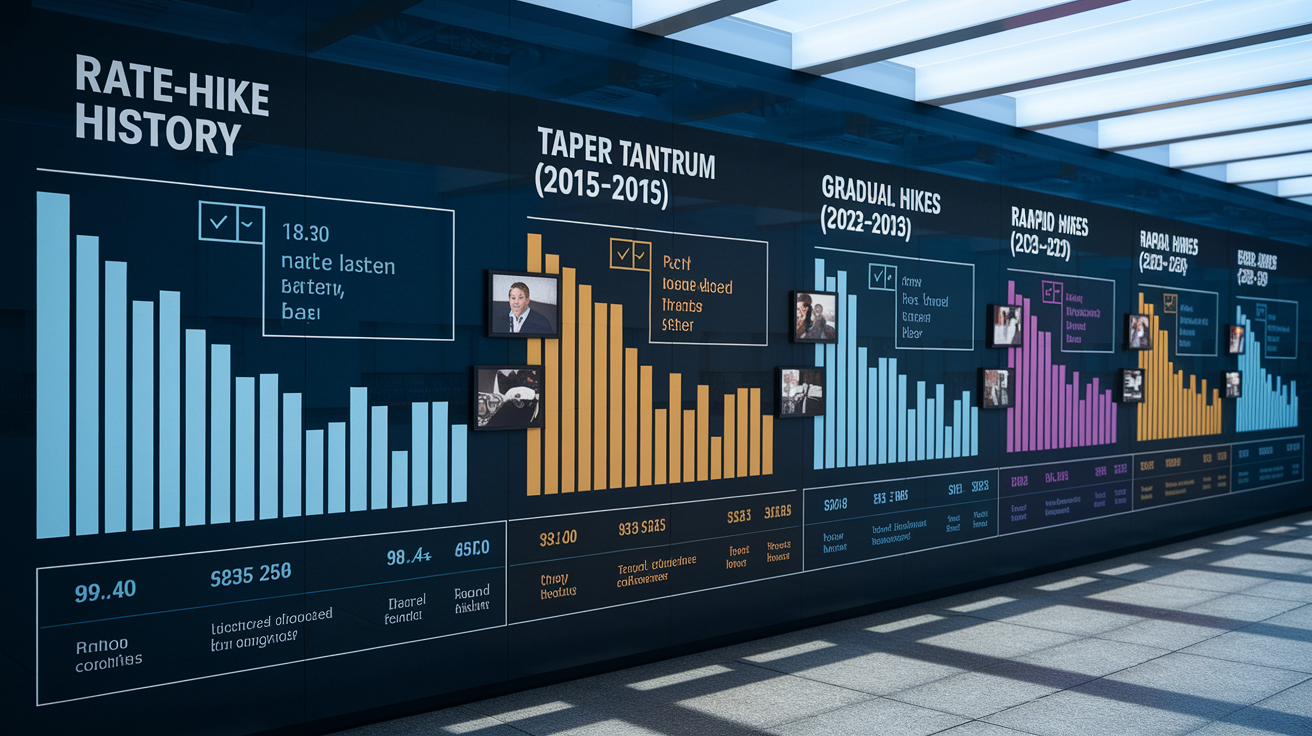
The 2013 taper tantrum offers a different lesson. The Fed signaled a reduction in quantitative easing, and Treasury yields spiked. Stocks wobbled but didn’t crash. Growth names continued to perform reasonably well because the economy was strengthening and corporate earnings supported valuations. But flows began shifting toward value and dividend payers.
By contrast, the 2015–2018 hiking cycle was gradual. The Fed raised rates in small, well-telegraphed steps. Growth initially held up, but by late 2018 bond yields became attractive enough to pull capital from equities, and value began outperforming as growth momentum stalled.
The 2022–2023 cycle was the sharpest in modern memory. The Fed moved from near zero to over 5 percent in roughly a year. Inflation ran hot, and the central bank prioritized tightening over market stability. High-growth names (especially unprofitable tech, SPACs, and speculative plays) saw brutal drawdowns. Value and defensive sectors gained favor as investors sought current cash flow and lower volatility.
Each cycle shows the same core dynamic: the speed and reason for rate hikes matter, but growth stocks consistently face greater pressure than value when rates rise meaningfully.
| Cycle | Rate Move | Growth Performance | Value Performance |
|---|---|---|---|
| 1999–2000 Dot-Com | Fed hikes into bubble | Nasdaq fell ~80%; severe correction | Traditional sectors held up better; outperformed |
| 2013 Taper Tantrum | QE taper signal, yield spike | Growth wobbled but stayed supported by earnings | Rotation toward value and income began |
| 2015–2018 Gradual Hikes | Small, steady rate increases | Held up initially; weakened by late 2018 | Value outperformed as yields rose and bond competition increased |
| 2022–2023 Rapid Hikes | 0% to 5%+ in ~12 months | Sharp declines; Nasdaq hit hard | Defensive sectors and financials outperformed; income assets gained favor |
Investor Behavior, Rotation Patterns, and Market Sentiment in Rising-Rate Environments
When rates climb, risk aversion rises. Investors shift capital from speculative, long-duration bets into assets with more certain near-term returns. That means selling high-P/E growth stocks and buying dividend payers, value names, and even bonds. The rotation is rarely smooth. Momentum amplifies the move as institutional money and ETF flows follow performance trends, deepening the shift.
In 2022 and 2023, ETF flows showed the pattern clearly. Flows into financial-sector funds, dividend-focused ETFs, and consumer-staples funds increased, while outflows hit high-growth technology and speculative thematic funds. The market’s leadership changed fast. Names that dominated in the zero-rate era (unprofitable tech, SPACs, long-duration growth) fell hard, while banks, energy, and defensive sectors attracted capital.
Market breadth matters too. In early stages of a hiking cycle, leadership often narrows. Fewer stocks participate in rallies as investors concentrate in quality and defensiveness. By late stages, if economic data weakens or rate hikes pause, growth can stage sharp rallies as traders anticipate easier conditions ahead.
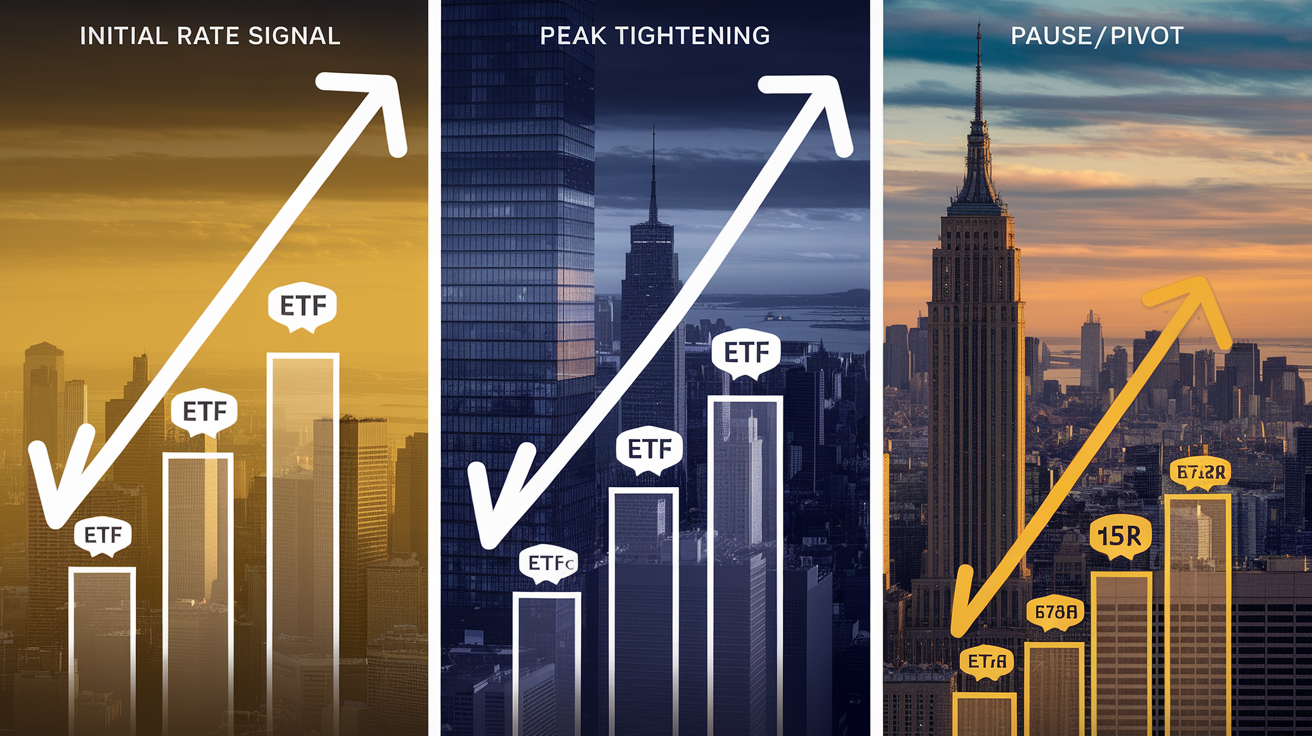
The typical rotation happens in three phases:
Initial rate signal. Growth stocks begin underperforming as discount rates rise. Defensive and financial sectors start to attract flows.
Peak tightening. Capital moves aggressively into value, income, and short-duration assets. Volatility spikes and breadth narrows.
Anticipation of pause or pivot. If hikes slow or economic data softens, speculative growth can rebound sharply as traders front-run easier policy.
Portfolio Positioning Strategies for Rate-Hike Cycles

Smart allocation during rate hikes starts with understanding duration. Favor companies with strong current cash flow, reasonable valuations, and less reliance on distant earnings projections. That typically means tilting toward value, financials, consumer staples, healthcare, and energy. Reduce exposure to high-P/E, unprofitable, or speculative growth names whose valuations depend on cash flows many years out.
Balance-sheet health becomes critical. Companies with low net debt or net cash positions can weather higher borrowing costs without margin pressure. Those with heavy debt loads face rising interest expense that cuts into profits. Look for firms with pricing power (the ability to raise prices without losing customers) because they can protect margins even as input and financing costs climb.
Diversification remains essential. Don’t dump all growth holdings. Keep exposure to high-quality growth companies with strong free cash flow, low leverage, and durable competitive advantages. These names can compound long-term value even during rate volatility. The goal is balance: reduce duration risk without abandoning long-term growth entirely.
Here are specific actions to consider:
Monitor Treasury yields as a signal. When the 10-year yield rises materially, the opportunity cost of holding speculative growth increases. Consider rebalancing toward income and value.
Favor dividend payers and buyback programs. Companies returning cash to shareholders through dividends or buybacks tend to support stock prices during volatility.
Tilt toward financials and energy. Financials benefit from wider interest margins. Energy often benefits from inflation and strong demand that accompany rate hikes.
Add defensive sectors. Consumer staples and healthcare provide stability and lower volatility during uncertain rate environments.
Use short-duration bonds or cash. Hold liquidity to fund rebalancing or capture buying opportunities when volatility spikes.
Screen for low leverage and strong returns on capital. Companies with high returns on invested capital and manageable debt withstand higher financing costs better.
Final Words
Rates rose, and prices rewrote future cash flows. Higher discount rates cut present values, squeezing long-duration growth names while nearer-term value earnings hold up better.
We ran through the mechanics, growth sensitivity, value resilience, historical cycles, rotation flows, and portfolio moves that matter.
If you want a quick takeaway, remember the guide to how interest rate hikes affect growth and value stocks. Use duration-aware positioning and stay diversified. There’s opportunity in discipline.
FAQ
Q: What happens to growth stocks when interest rates rise?
A: Growth stocks typically fall when interest rates rise because higher rates increase discount rates, lowering the present value of distant earnings and compressing high P/E multiples that tilt toward growth names.
Q: What is the 7% rule in stocks?
A: The 7% rule in stocks treats roughly 7% as a long‑term average annual return assumption used for planning, but it’s an estimate, not a guaranteed future return.
Q: What is the 70 30 rule Warren Buffett?
A: The 70/30 rule linked to Warren Buffett refers to roughly allocating 70% to equities and 30% to bonds or cash as a simple long‑term mix; Buffett emphasizes value, patience, and flexibility over strict ratios.
Q: What is the 3 day rule for stocks?
A: The 3 day rule for stocks usually means holding a new position at least three trading days to avoid short‑term noise and let the trend clarify; exact timing depends on your strategy and broker.