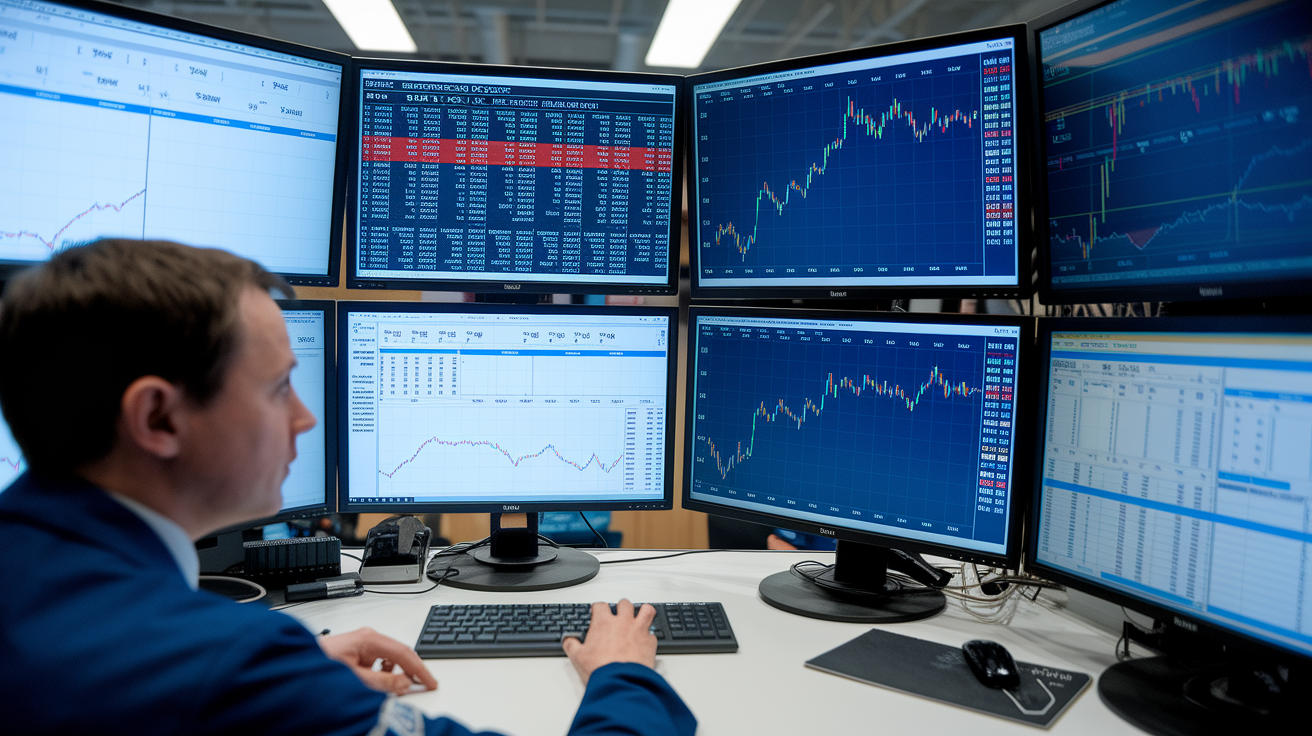
What if a single big options trade—executed in seconds—can push a stock higher before anyone else notices?
Options flow is the live tape of executed options trades (strike, size, price, buy/sell), and large, aggressive buys often force dealers to hedge by buying the underlying stock, creating immediate buying pressure.
This intro shows how that hedging turns flow into price moves, which signals matter, and how to spot high-impact orders that often precede sharp stock moves.
Core Explanation of Options Flow and Its Impact on Stock Movement
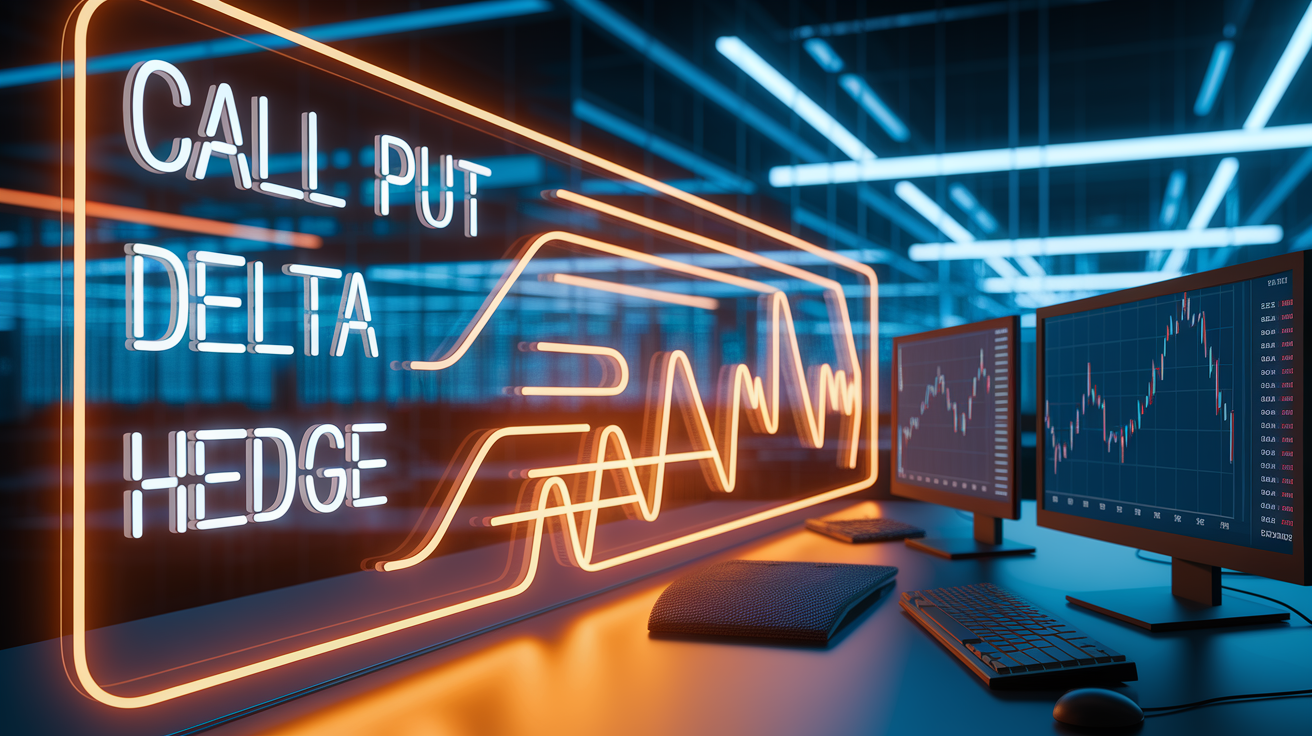
Options flow is the real-time record of executed options trades. Strike price, expiration date, contract size, premium paid, how aggressively the order got filled—all of it shows up in the stream. It’s basically the transaction tape for options markets. Every sweep, block, and single fill gets tagged with whether it was a buy or sell, at what price, and how much premium changed hands.
Order flow is the broader concept covering all executed orders across equities, options, sometimes futures. But when traders say “options flow,” they’re zeroing in on options-specific activity. Why? Those trades can reveal institutional positioning before it shows up in the stock itself.
The reason options flow gets attention is that large institutional option trades force market makers and dealers to hedge their exposure by buying or selling the underlying stock. When a hedge fund buys 5,000 call contracts, the dealer on the other side doesn’t want directional risk, so they buy shares to stay neutral. That hedging demand hits the stock in real time, creating buying or selling pressure that can push price before the broader market understands what’s happening.
The magnitude of that pressure depends on the size of the trade, the delta of the options, and how much liquidity is available in the underlying stock. Options flow matters most when trades are large, aggressive, and concentrated in specific strikes or expirations. A single 10,000-contract sweep executed across multiple exchanges in seconds signals urgency and often precedes a move in the stock. Smaller trades or passive limit orders may not trigger the same hedging response, so understanding the context is essential for separating signal from noise.
Key factors that allow options activity to move stocks:
Dealer hedging mechanics. Market makers hedge sold options by buying or selling the underlying stock to offset delta exposure.
Contract size and notional value. Larger trades force proportionally larger stock hedges, sometimes exceeding 1–2% of daily volume.
Time to expiration. Short-dated options carry higher gamma, meaning dealer hedges adjust more aggressively as the stock moves.
Strike concentration. Repeated flow into the same strike creates localized pressure and can act as a magnet or resistance level.
Liquidity conditions. In thinly traded names, even moderate options activity can overwhelm available stock supply and amplify price moves.
Foundational Concepts Behind Options Flow Signals

Unusual options activity (UOA) refers to trades that stand out against normal patterns. Either because of their size, aggression, or timing. The most common baseline is relative volume: if a stock’s options normally trade 500 contracts per day and suddenly 5,000 contracts trade in an hour, that 10x spike is a red flag. Traders watch for volume multiples of 5x, 10x, or 20x above the average, especially when those trades are buy-to-open (new positions) rather than closes or rolls.
A sweep order is a large order executed across multiple exchanges simultaneously, signaling urgency. The buyer is willing to pay the ask on every venue to fill the entire size immediately. That suggests conviction or time sensitivity. Block trades (single prints of hundreds or thousands of contracts) also indicate institutional activity, though they may be negotiated off-exchange and reported later.
Both sweeps and blocks matter more when they’re opening new positions, which you can confirm by watching open interest (OI) changes the next day.
Core signals that flag unusual options activity:
Relative volume spikes. 5x to 20x above the trailing average for that ticker’s options.
Large single-block trades. 1,000+ contracts for liquid names, 100–500 for small caps.
Sweep executions. Orders hitting multiple exchanges in rapid succession, typically at the ask.
Out-of-the-money (OTM) concentration. Heavy buying of strikes far from current price, especially short-dated.
Volume-to-open-interest ratio >0.2. Indicates fresh directional positioning rather than closing or rolling existing trades.
Repeated flow. Multiple large orders over hours or days at the same strike/expiration, showing sustained accumulation.
Distinguishing buy-to-open from sell-to-close or position rolls is critical. If open interest rises alongside heavy volume, new positions are being established. If volume is high but OI flat or falling, traders are likely exiting or adjusting. Changes the interpretation entirely.
How Market Maker Hedging Turns Options Flow Into Stock Buying or Selling Pressure

The direct link between options flow and stock movement comes down to delta hedging. When a dealer sells call options to a buyer, the dealer is short those calls and faces upside risk if the stock rallies. To neutralize that risk, the dealer buys shares of the underlying stock in proportion to the option’s delta. The formula is simple: shares hedged = contracts × 100 × delta.
If someone buys 2,000 call contracts with a delta of 0.6, the dealer on the other side must buy 2,000 × 100 × 0.6 = 120,000 shares to stay delta neutral. That 120,000-share buy order hits the market and can move the stock higher, especially if liquidity is thin or the trade happens during a breakout. For puts, the mechanics reverse. Dealers hedge by selling stock when they sell puts, creating downward pressure.
Gamma is what turns hedging from a one-time adjustment into a dynamic feedback loop. Gamma measures how much delta changes for every $1 move in the stock. If those same 2,000 contracts have a gamma of 0.03, every $1 the stock rises forces the dealer to buy an additional 2,000 × 100 × 0.03 = 6,000 shares. If the stock keeps climbing, dealers keep buying, amplifying the move.
This gamma effect is strongest in short-dated options. Inside 30 days and especially in the final week before expiration. Because gamma increases sharply as time to expiry shrinks. A 0.5-delta call expiring in 60 days might have a gamma of 0.01, but the same strike expiring in seven days could have a gamma of 0.08, meaning dealers adjust their hedges eight times more aggressively per dollar of stock movement.
This creates what traders call a gamma squeeze. When large buy-to-open call flow concentrates in short-dated strikes, dealers are forced to buy stock as the price rises, which pushes the price higher, which increases delta further, which forces more buying. The cycle can run for hours or days until expiration, a sharp reversal, or profit-taking breaks the loop.
Example: 500 contracts of near-expiry calls with gamma 0.02 produce a hedge adjustment of 500 × 100 × 0.02 = 1,000 shares per $1 stock move. In a small-cap name trading 200,000 shares per day, that’s material incremental demand every tick higher.
Identifying High-Impact Options Flow Events

Not all options flow is created equal. High-impact flow combines size, aggression, and market context.
Sweep orders that hit every exchange at once show a buyer willing to pay up for immediate execution. They’re not trying to work the order passively or wait for a better fill. That urgency often precedes a catalyst or reflects information the broader market hasn’t priced in yet. Block trades, especially those printing well above average daily option volume, signal institutional conviction or hedging tied to a larger position in the stock or portfolio.
Size thresholds vary by ticker. For a large-cap, liquid name, a single trade below 1,000 contracts or $500,000 in premium rarely moves the needle. But for a small-cap stock with low float and thin option markets, even 100–500 contracts can overwhelm hedging capacity and create outsized stock movement.
Premium-weighted analysis matters too. 1,000 contracts of cheap $0.10 options ($10,000 total premium) is very different from 1,000 contracts of $5.00 options ($500,000 premium). The latter forces far more hedging and represents a bigger capital commitment.
Characteristics of high-impact options flow:
Sweeps across multiple exchanges. Signals urgency and willingness to pay the offer, not passive accumulation.
Block trades exceeding daily average volume. Institutional-size orders that can’t be hidden or worked slowly.
Premium notional >$500k–$1M. Large enough to require meaningful stock hedging and reflect serious capital allocation.
Concentration in short-dated, high-gamma strikes. Amplifies hedging feedback loops and dealer responsiveness to price moves.
Timing and repetition also matter. A single large sweep could be a one-off hedge or a position initiated before a known event. Repeated large orders over hours or days, especially at the same strike and expiration, suggest deliberate accumulation and higher confidence in a directional move.
Real Examples of Options Flow Preceding Stock Moves
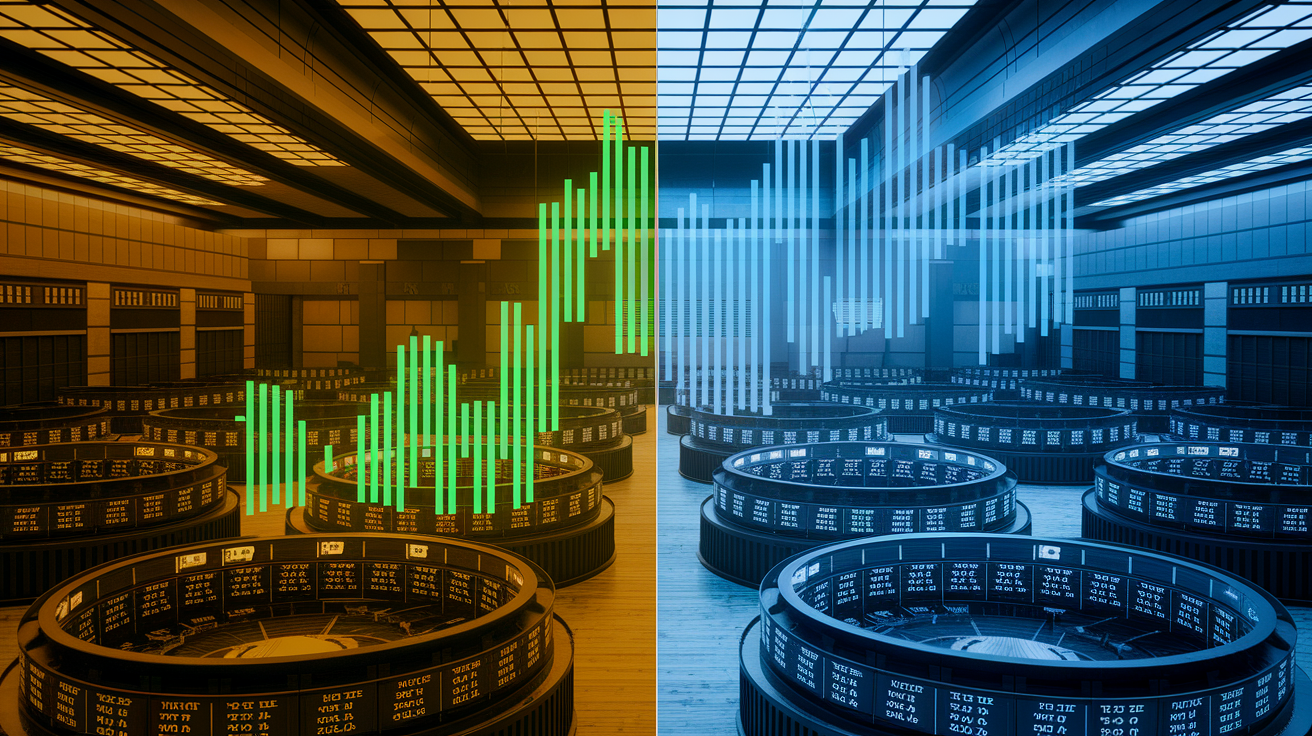
In a hypothetical scenario on March 15, a trader buys 5,000 call contracts at a $150 strike expiring in 30 days, with an average delta of 0.60. The immediate hedging demand is 5,000 × 100 × 0.6 = 300,000 shares. If the stock’s average daily volume is 3,000,000 shares, that hedge represents 10% of a full day’s volume hitting the market in a short window.
The stock rallies from $148 to $152 within hours, and as delta increases to 0.70, dealers must buy another (0.70 − 0.60) × 500,000 = 50,000 shares, adding fuel to the move. By expiration, the stock sits at $155, and the option finishes in the money. Flow preceded and amplified the rally.
Small-float stocks show even more dramatic effects. A biotech name with 10 million shares outstanding and 200,000 average daily volume sees a buy-to-open sweep of 800 call contracts, delta 0.50. That’s 800 × 100 × 0.5 = 40,000 shares hedged—20% of the day’s typical volume. The stock jumps 8% intraday as hedging demand overwhelms the order book. The next day, open interest confirms the new position, and the stock continues higher as dealers adjust gamma hedges.
Another pattern: a stock trading at $90 breaks resistance at $92 after a trader buys 5,000 contracts of $100 calls expiring in two weeks. The flow hits before the breakout, suggesting informed positioning. Within 48 hours, the stock runs to $98, and the options triple in value. Compare that to a day when 10,000 contracts trade but normal daily volume is only 500. The 20x relative volume spike alone flags the activity as unusual, and the resulting price action confirms the signal.
| Flow Event | Shares-Equivalent Impact | Resulting Price Action |
|---|---|---|
| 5,000 calls, delta 0.6, $150 strike | 300,000 shares hedged (10% of ADV) | Stock rallied $148 → $155 over two weeks |
| 800 calls, delta 0.5, small-cap biotech | 40,000 shares hedged (20% of ADV) | +8% intraday spike, continued rally next session |
| 5,000 calls, $100 strike, stock at $90 | Triggered breakout at $92 resistance | $90 → $98 within 48 hours post-breakout |
How to Interpret Options Flow for Directional Bias

Determining whether flow is directional or neutral starts with identifying buy-to-open versus closing trades. If open interest rises the next day by an amount close to the prior day’s volume, those were new positions. If open interest stays flat or drops, traders were closing or rolling.
Directional flow, especially aggressive buy-to-open sweeps of calls or puts, suggests conviction in a move. Hedging flow, like large institutions buying puts to protect long equity, can look similar in size but may not indicate bearish intent on the stock itself.
Implied volatility (IV) behavior adds context. When aggressive call buying drives IV higher, it means dealers are charging more premium to sell, which can dampen the stock’s upside if the move doesn’t materialize. Conversely, if heavy call buying happens while IV drops or stays flat, it suggests sellers are comfortable taking the other side, and the flow may be less impactful.
Concentration in specific strikes and expirations is another tell. Repeated flow into the same $100 call expiring in two weeks is more directional than scattered activity across many strikes and dates.
Steps to determine if flow is directional or hedging:
Check next-day open interest change. Rising OI confirms new positions; flat OI suggests closes or rolls.
Observe implied volatility movement. Rising IV on aggressive buys may indicate hedging demand; stable IV suggests balanced interest.
Assess strike and expiration clustering. Concentrated flow in one strike/expiry signals conviction; dispersed flow is often neutral or portfolio hedging.
Compare to stock price action. Flow that precedes breakouts or aligns with volume spikes is more likely directional.
Evaluate premium-weighted vs contract-weighted size. High premium per contract indicates deeper pockets and often institutional directional bets.
When call sweeps hit and the stock breaks a technical level minutes later, that’s confirmation. When heavy put buying coincides with a stock holding support and IV spiking, it’s likely protective hedging, not a bearish bet.
Practical Workflow for Using Options Flow in Trading

Start by filtering for size and aggression. Set alerts or scanners for trades above a threshold: 1,000+ contracts for large caps, 100–500 for small caps, or premium notional above $500,000. Flag sweep orders and blocks separately; these are the highest-urgency signals.
Once a trade appears, calculate the shares-equivalent hedging demand: contracts × 100 × delta. Compare that to average daily volume (ADV). If the hedged shares represent 1–2% or more of ADV, the trade has the size to move the stock.
Next, check the volume-to-open-interest ratio for that strike and expiration. A V/OI above 0.2 on the day suggests new positioning rather than exits. Look at implied volatility. Did it spike or contract after the trade? Rising IV can mean dealers are pricing in event risk or hedging costs; falling IV after a large buy might indicate the seller was comfortable and the trade less informational.
Confirm delta and time to expiry: high-delta (>0.40) and short-dated options (<30 days) produce the most aggressive hedging responses.
Finally, confirm with price action before trading. Flow is a leading indicator, but it’s not a guarantee. Wait for the stock to break a level, show volume confirmation, or hold support on a pullback. Manage risk with position sizing, stops, and scaling. Even strong flow can reverse if the stock hits resistance, liquidity dries up, or a counter-narrative emerges.
Workflow checklist for actionable options flow:
Filter for size and aggression. Sweeps, blocks, or multi-trade clusters within 15–30 minutes.
Compute shares-equivalent impact. Contracts × 100 × delta, then compare to ADV.
Verify volume-to-open-interest ratio. >0.2 flags fresh directional positions.
Check delta, gamma, and days to expiry. High-delta and short-dated options produce stronger hedging effects.
Confirm with stock price, volume, and levels. Breakouts, retests, or continuation patterns validate the flow signal.
Set risk parameters. Smaller position size, defined stops, and scale-in/out rules to manage uncertainty.
Use flow as a bias generator, not a standalone trigger. When flow, technicals, and momentum align, conviction increases. When they diverge, wait for clarity or pass on the trade.
Tools and Data Sources for Tracking Options Flow
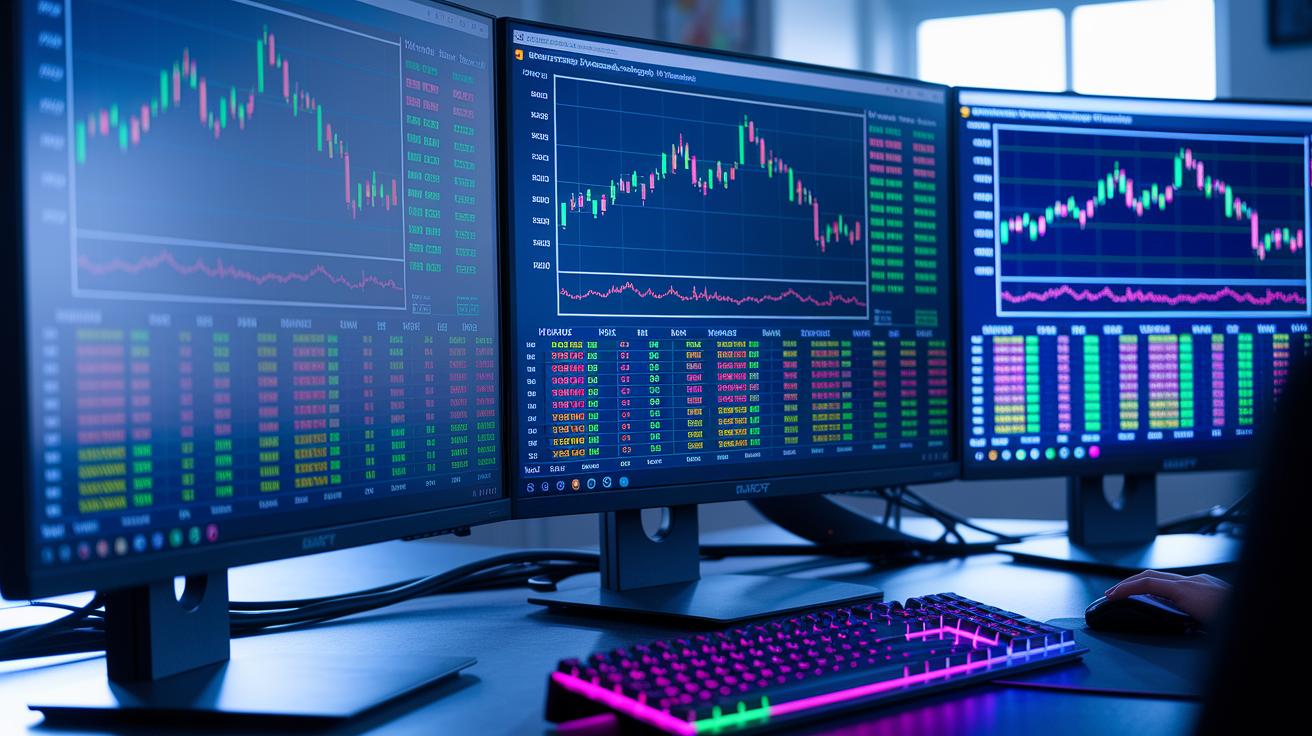
Options flow scanners automate the heavy lifting. Filtering real-time trades by size, premium, aggression, and relative volume. Most platforms offer sweep detection, which highlights orders executed across multiple exchanges in rapid succession. OTM filters let you focus on speculative bets far from the current price, and near-term expiration filters isolate high-gamma setups.
Relative-volume multipliers (5x, 10x, 20x) flag unusual activity against historical norms, and contract-count or notional thresholds ensure you’re not drowning in noise from small trades.
Real-time data feeds typically run with latency between 500 milliseconds and 15 seconds during market hours, depending on network speed and processing. Equity block and print data can be delayed up to 15 minutes due to exchange reporting rules. Dark-pool transactions often report hours later, sometimes the next trading day, or if a trade happens Friday, not until Monday.
That delay means some “unusual activity” alerts are backward-looking, useful for pattern recognition but not for real-time entry. Sweep data and exchange-listed options flow are the most actionable for intraday traders because the lag is minimal. For a deeper look at how traders use these signals in practice, the Option Flow Analysis Q&A at https://www.whalestream.com/trading-education-resources/education-tips/what-is-option-flow-analysis walks through common questions and interpretation strategies.
Common scanner capabilities:
Sweep and block detection. Flags aggressive multi-exchange orders and large single prints.
Strike and expiration filters. Isolates OTM, ATM, or ITM activity and short-dated vs long-dated flow.
Relative volume and V/OI ratio alerts. Highlights trades exceeding historical norms or indicating new positions.
Premium and contract-count thresholds. Filters by notional size or absolute contract volume to surface institutional-scale trades.
Most platforms also offer historical flow archives, letting you backtest patterns and correlate past flow with subsequent price moves.
Risks, Limitations, and Common Mistakes When Using Options Flow

Options flow is a signal, not proof of intent. Many large trades are part of complex strategies: spreads, collars, conversions, or portfolio hedging. They don’t imply a directional bet on the stock. A trader buying 5,000 calls and simultaneously selling 5,000 calls at a higher strike creates large flow in both directions but is delta-neutral overall. Misreading that as bullish leads to bad trades.
Implied volatility traps are another risk. Institutions often sell premium into elevated IV, so large call selling during high IV might be a credit play, not a bearish signal. Conversely, buying calls when IV is elevated means you’re paying top dollar for time premium, which decays fast if the stock doesn’t move.
Data latency and dark-pool delays mean some alerts are hours old by the time you see them. Real-time sweeps on listed exchanges are reliable, but off-exchange block prints can be stale. Confusing volume with open interest is common. High volume with flat OI indicates rolling or closing positions, not fresh directional bets. Always check next-day OI to confirm.
Failure to confirm flow with price action and technical context is the fastest way to chase bad signals. Flow can precede a move, but if the stock hits resistance and reverses, the flow was either wrong, early, or part of a hedge that won’t drive further buying.
Common mistakes when using options flow:
Assuming every large trade is directional. Many are spreads, hedges, or portfolio adjustments with no stock-price implication.
Chasing trades into elevated implied volatility. Overpaying for premium that decays quickly if the move stalls.
Ignoring open interest changes. Mistaking high volume for new positions when OI is flat (closes or rolls).
Trading flow without price confirmation. Entering before the stock breaks a level or shows follow-through volume.
Overlooking data delays. Acting on dark-pool prints that are hours old and already reflected in price.
Best practice: treat flow as one input in a multi-factor decision. Combine it with price action, volume, IV trends, and catalyst timing. Size positions conservatively, use stops, and recognize that even large institutional trades can be wrong or take time to play out.
Final Words
In the action: options flow is the live record of executed options trades — strike, expiry, size, premium, and aggressiveness — distinct from general order flow.
We covered how big institutional bets can force dealer hedges that create real buying or selling pressure, plus the signals and a compact workflow to filter what matters.
For a quick answer to what is options flow and how it moves stocks: flow flags concentrated risk, and hedging turns that into stock pressure. Use filters and risk rules — it should give you a clearer read.
FAQ
Q: What is an options flow?
A: The options flow is a real-time record of executed options trades showing strike, expiry, size, premium, and aggressiveness, used to spot big bets and potential dealer hedging that can move stocks.
Q: What is the 3-5-7 rule in trading?
A: The 3-5-7 rule in trading is a short-term moving-average setup using 3-, 5-, and 7-period averages; crossovers flag early trend changes and quick entries, but it’s noisy and best paired with volume or price confirmation.
Q: Do professional traders use orderflow?
A: Professional traders do use order flow (the live stream of executed buys and sells) to read supply and demand, inform entries, and size positions — but they combine it with risk controls and other signals.
Q: Why do 90% option traders lose money?
A: The 90% of option traders who lose money do so because options are leveraged and decay with time; add poor risk management, oversized positions, misunderstood probabilities, and chasing noisy signals.